Direct Access To All Multiple Listings Like Realtors®

(Prices and inventory current as of Nov 30, 1999)

See Pictures and updates (icon)See photos and updates from listings directly in your feed

Share with you friends (icon)Share your favorite listings with friends and family

Save your search (icon)Save your search and get new listings directly in your mailbox before everybody else

Direct Access To All Multiple
Listings Like Realtors®

(Prices and inventory current as of Nov 30, 1999)

See Pictures and updates (icon)See photos and updates from listings directly in your feed

Share with you friends (icon)Share your favorite listings with friends and family

Save your search (icon)Save your search and get new listings directly in your mailbox before everybody else

Sign Up

it's quick and easy

We'll never post to social networks

or

  • This field is for validation purposes and should be left unchanged.

Already an account? Log in here

Log in

Please check username or password!

No account yet? Register here

Password forgotten? Reset your password

Reset your password

The email address does not seems to be correct!

Please check your email to reset your password

No account yet? Register here

Real Estate Market Update | Scottsdale | Quarter 2, 2023 vs Quarter 2, 2022

Real Estate Market Update | Scottsdale | Quarter 2, 2023 vs Quarter 2, 2022

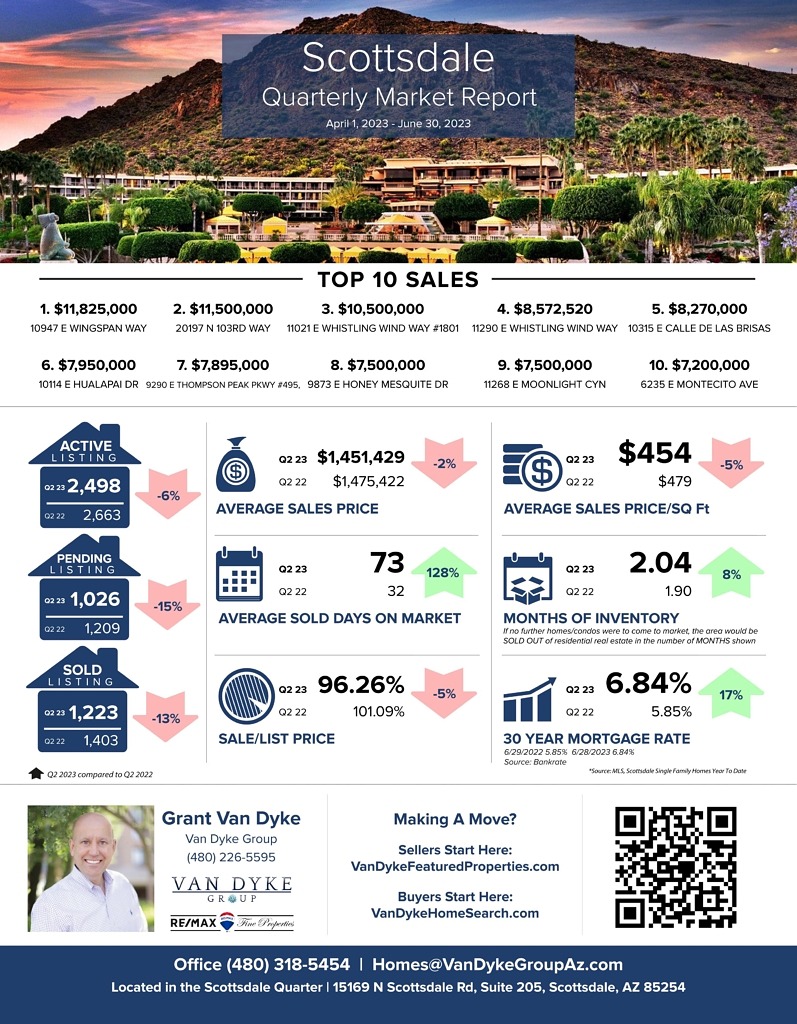
In June 2023, the housing market in Scottsdale had a solid performance, benefiting home sellers. Overall, these statistics reflect a resilient housing market in Scottsdale during June 2023. The lower number of sold listings, adjusted average sales price, increased inventory, and slightly higher mortgage rates are all indicative of a favorable environment for home sellers. – Grant Van Dyke

Scottsdale 

Average Sales Price: Q2 2022 > $1,475,422 vs Q2 2023 > $1,451,429 = 2% decrease 

Average Days On Market: Q2 2022 > 32 vs Q2 2023 > 73 = 128% increase 

Average Sale Price Per Square Foot: Q2 2022 > $479 vs Q2 2023 > $454 = 5% decrease 

Sale to List Price Ratio: Q2 2022 > 101.09% vs Q2 2023 > 96.26% = 5% decrease 

Number of Sold Listing: Q2 2022 > 1403 vs Q2 2023 > 1223 = 13% decrease 

Months Supply of Inventory: Q2 2022 > 1.9 vs Q2 2023 > 2.04 = 8% increase 

Mortgage Rate: Q2 2022 > 5.85% vs Q2 2023 > 6.84% = 17% increase 

Top 10 Sales 

$11,825,000 10947 E Wingspan Way

$11,500,000 20197 N 103rd Way

$10,500,000 11021 E Whistling Wind Way #1801

$8,572,520 11290 E Whistling Wind Way

$8,270,000 10315 E Calle de las Brisas

$7,950,000 10114 E Hualapai Drive

$7,895,000 9290 E Thompson Peak Pkwy #495 

$7,500,000 9873 E Honey Mesquite Dr

$7,500,000 11268 E Moonlight Cyn

$7,200,000 6235 E Montecito Ave

Recent Posts

Categories

Archives