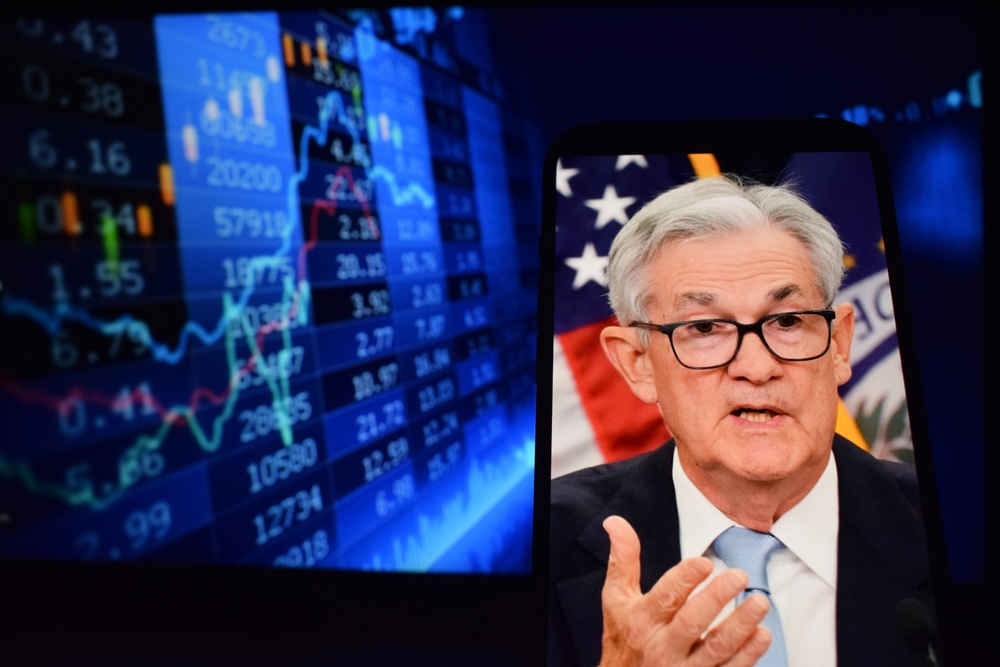
At the European Central Bank’s prestigious annual forum in Sintra, Portugal, on July 1, 2025, Federal Reserve Chair Jerome Powell took the stage alongside global counterparts, offering a clear message: the Fed is exercising caution, not making hasty decisions. While markets had been hoping for a signal that interest rate cuts were imminent, Powell instead […]
The end goal of a property transaction is for both the buyer and seller to come together and say yes to both the price and terms of an offer. There are many factors that go into the final price, including the market and the condition of the home, and it is inevitable both the buyer […]
Getting the cost of major upgrades at your place is a great starting point when you are looking to sell your home. When you decide to put your home on the market, one of the big decisions you have to make is whether you should complete those major renovation projects you have put off. If […]
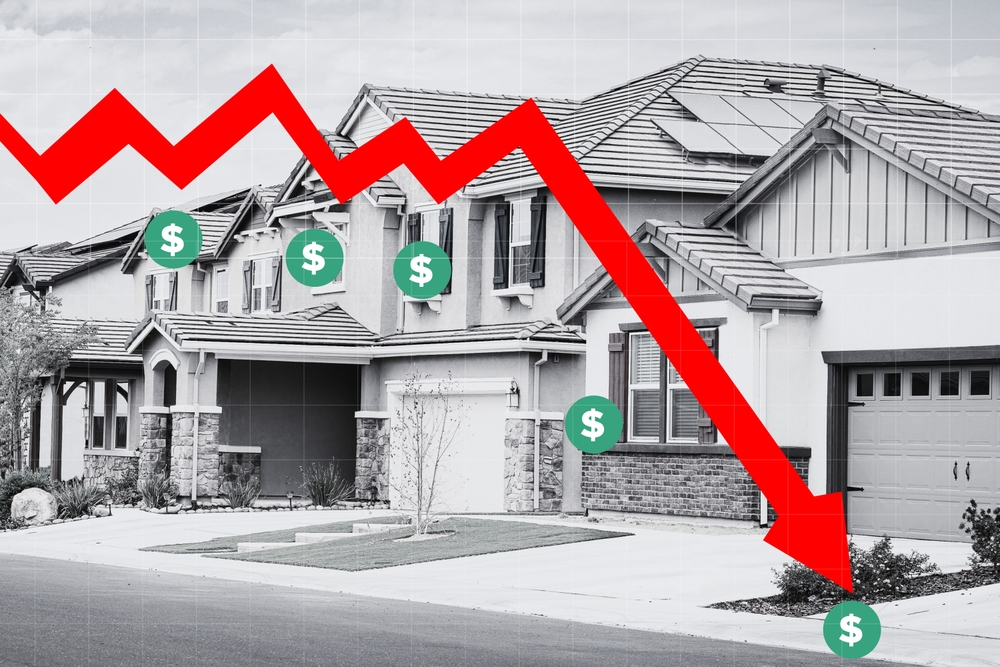
This summer was supposed to be the season when housing regained its momentum. Warmer weather, pent-up demand, and some long-awaited relief from high mortgage rates were all expected to spark activity. But instead of momentum, we’ve got a market clouded by rising global tension, stubbornly high interest rates, and an economy that seems to be […]
On June 18, 2025, the Federal Reserve announced that it would hold its benchmark interest rate steady at 4.25% to 4.50%, opting to maintain its current course in the face of elevated inflation and rising global trade tensions. While Fed officials continue to signal that two rate cuts may still be forthcoming before the end […]
Avoid the trap of mind games during the negotiation stage. Stay calm, professional, and rational throughout the discussions to put your best foot forward. If your offer isn’t accepted, do not become too discouraged! Some markets are extremely competitive, and you have to be respectful of your budget. There will be another property you love […]
A recent headline from Redfin sparked a national conversation: the U.S. housing market now has nearly 500,000 more home sellers than buyers—the most significant gap in over a decade. Based on April 2025 MLS listings and Redfin’s buyer activity models, the report suggests a subtle yet important shift toward a buyer’s market. Here in Scottsdale […]
Many of the pain point items an inspector will find in your home are low hanging fruit projects that may not take you a lot of time or money to fix. Why is this so crucial? Home buyers are happy to pay top dollar for a house that is move-in ready and doesn’t have a […]
In the coming months, it’s essential to monitor how rising inventory in Scottsdale affects the market, particularly in mid-range price points. While luxury homes continue to command top dollar, overall sales activity is softening under the weight of higher mortgage rates, now nearing 7%. Sellers should focus on strategic pricing and presentation, while buyers may […]
In the coming months, watch for buyers gaining more leverage as inventory continues to rise across Metro Phoenix markets. Mortgage rates have climbed to 6.94%, which may pressure affordability and influence buyer urgency. Despite slower sales, average prices remain strong, suggesting that pricing strategy and property positioning will be key for both buyers and sellers […]