
In Quarter 1, 2024, Scottsdale saw a 1% increase in Sold properties compared to Quarter 1, 2023, yet Average Sales prices increased by 9%. Despite this, Inventory rose, offering homebuyers more choices and bargaining power. As we enter Quarter 2, our seasonally strong period for sales, attention turns to potential rate cuts by the Federal Reserve. The timing and extent of these cuts hinge on factors like inflation and employment. The median prediction among Fed officials remains at three rate cuts for 2024. Time… Inflation… & Employment will tell.
– Grant Van Dyke
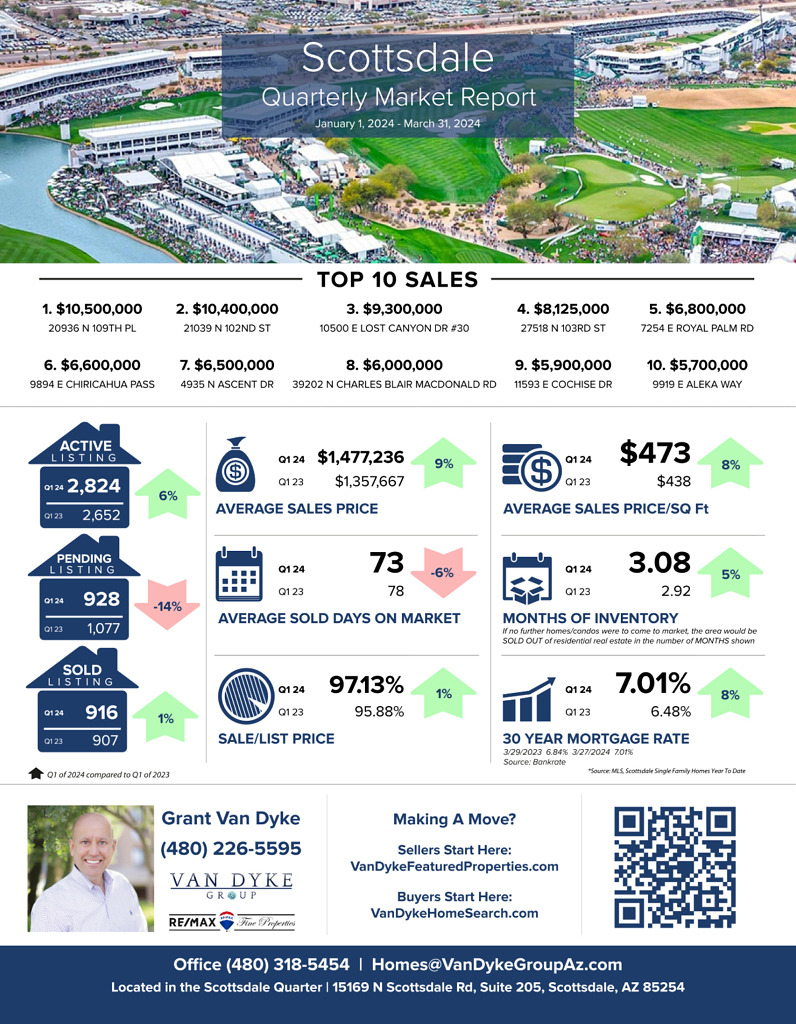
Scottsdale
Average Sales Price: Q1 2023 > $1,357,667 vs Q1 2024 > $1,477,236 = 9% increase
Average Days On Market: Q1 2023 > 78 vs Q1 2024 > 73 = 6% decrease
Average Sale Price Per Square Foot: Q1 2023 > $438 vs Q1 2024 > $473 = 8% increase
Sale to List Price Ratio: Q1 2023 > 95.88% vs Q1 2024 > 97.13% = 1% increase
Number of Sold Listings: Q1 2023 > 907 vs Q1 2024 > 916 = 1% increase
Months Supply of Inventory: Q1 2023 > 2.92 vs Q1 2024 > 3.08 = 5% increase
Mortgage Rate: Q1 2023 > 6.48% vs Q1 2024 > 7.01% = 8% increase
Top 10 Sales
$10,500,000 20936 N 109th Place
$10,400,000 21039 N 102nd St
$9,300,000 10500 E Lost Canyon Dr #30
$8,125,000 27518 N 103rd St
$6,800,000 7254 E Royal Palm Rd
$6,600,000 9894 E Chiricahua Pass
$6,500,000 4935 N Ascent Dr
$6,000,000 39202 N Charles Blair MacDonald Rd
$5,900,000 11593 E Cochise Dr
$5,700,000 9919 E Aleka Way


