
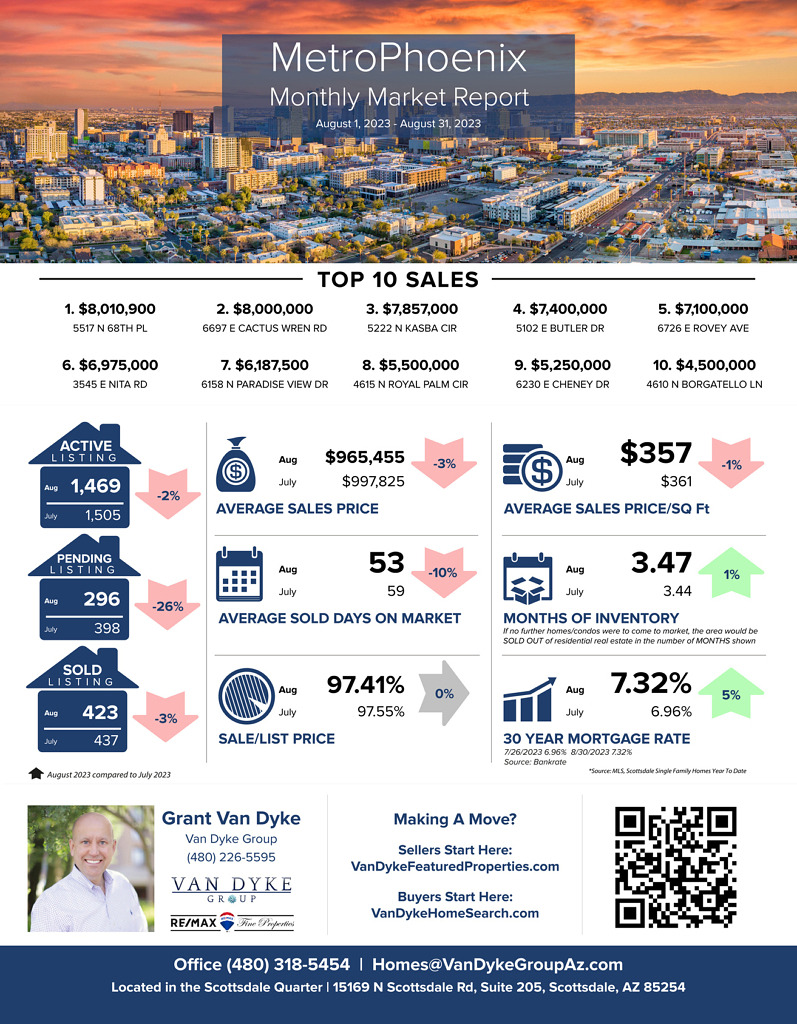
The Metro Phoenix market saw a 3% drop in the Average Sales Price, now at $965,455, leading to a $357 Average Price Per Square Foot. Inventory increased slightly to 3.47 month’s worth of properties for sale. When the 30-year fixed mortgage rate stays above 7%, demand for resale homes is so weak that more is needed to eat up the small number of new listings that appear each week. Available supply is starting to grow, and the seller’s advantage is fading.
– Grant Van Dyke
Metro Phoenix
Average Sales Price: July 2023 > $997,825 vs August 2023 > $965,455 = 3% decrease
Average Days On Market: July 2023 > 59 vs August 2023 > 53 = 10% decrease
Average Sale Price Per Square Foot: July 2023 > $361 vs August 2023 > $357 = 1% decrease
Sale to List Price Ratio: July 2023 > 97.55% vs August 2023 > 97.41% = 0% Change
Number of Sold Listings: July 2023 > 437 vs August 2023 > 423 = 3% decrease
Months Supply of Inventory: July 2023 > 3.44 vs August 2023 > 3.47 = 1% increase
Mortgage Rate: July 2023 > 6.96% vs August 2023 > 7.32% = 5% increase
Top 10 Sales
$8,010,900 5517 N 68th Place, Paradise Valley
$8,000,000 6697 E Cactus Wren Rd, Paradise Valley
$7,857,000 5222 N Kasba Circle, Paradise Valley
$7,400,000 5102 E Butler Drive, Paradise Valley
$7,100,000 6726 E Rovey Avenue, Paradise Valley
$6,975,000 3545 E Nita Road, Paradise Valley
$6,187,500 6158 N Paradise View Drive, Paradise Valley
$5,500,000 4615 N Royal Palm Circle, Phoenix
$5,250,000 6230 E Cheney Drive, Paradise Valley
$4,500,000 4610 N Borgatello Lane, Phoenix


