
In the coming months, it’s important to watch for whether rising inventory continues to give buyers more leverage and soften home prices further. Sellers may need to adjust expectations as properties take longer to move and pricing becomes more critical in a competitive market. With mortgage rates holding steady, buyer activity could pick up, making timing and strategy essential on both sides of the transaction.
– Grant Van Dyke
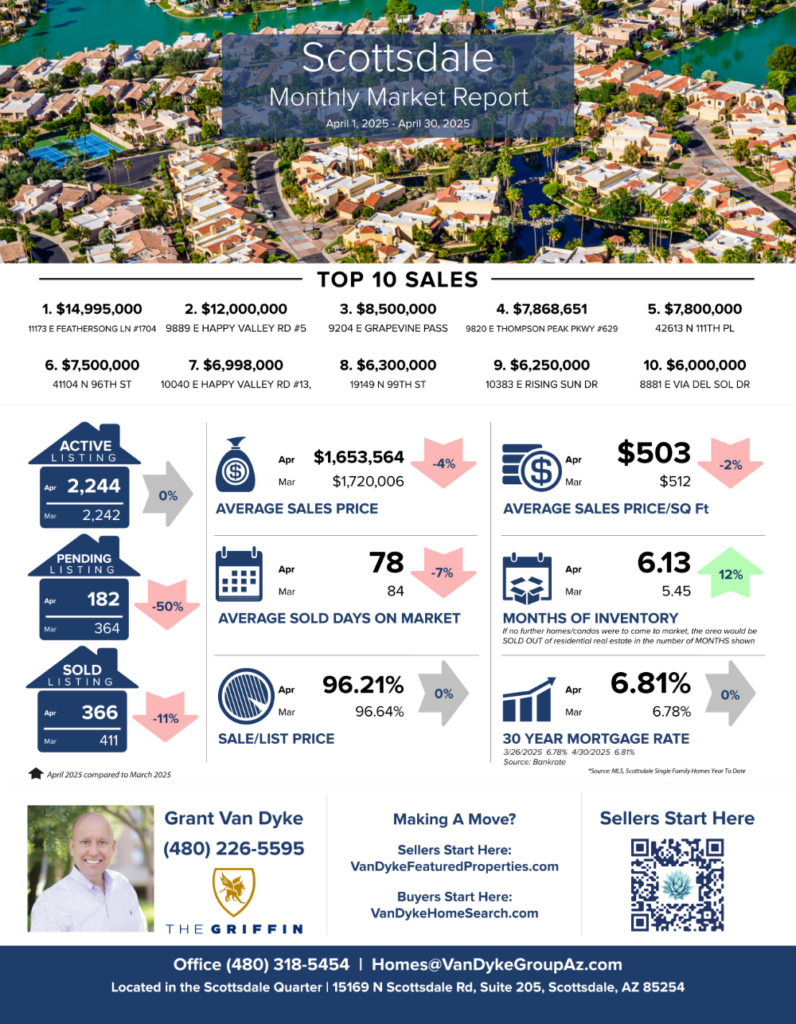
Scottsdale
Average Sales Price: March 2025 > $1,720,006 vs April 2025 > $1,653,564 = 4% decrease
Average Days On Market: March 2025 > 84 vs April 2025 > 78 = 7% decrease
Average Sale Price Per Square Foot: March 2025 > $512 vs April 2025 > $503 = 2% decrease
Sale to List Price Ratio: March 2025 > 96.64% vs April 2025 > 96.21% = 0% change
Number of Sold Listings: March 2025 > 411 vs April 2025 > 366 = 11% decrease
Months Supply of Inventory: March 2025 > 5.45 vs April 2025 > 6.13 = 12% increase
Mortgage Rate: March 2025 > 6.78% vs April 2025 > 6.81% = 0% change
Top 10 Sales
$1,4995,000 11173 E Feathersong Ln #1704
$1,2000,000 9889 E Happy Valley Rd #5
$8,500,000 9204 E Grapevine Pass
$7,868,651 9820 E Thompson Peak Pkwy #629
$7,800,000 42613 N 111th Pl
$7,500,000 41104 N 96th St
$6,998,000 10040 E Happy Valley Rd #13
$6,300,000 19149 N 99th St
$6,250,000 10383 E Rising Sun Dr
$6,000,000 8881 E Via Del Sol Dr
GRAB OUR FREE COURSES
➡️ 6 Steps To Home Buyer Success – http://vandykebuyerplan.com
➡️ 7 Steps To Home Seller Plan – http://vandykesellerplan.com
➡️ 8 Steps To Agent Success – http://vandykeagentplan.com


