
In the coming months, inventory and mortgage rates will be the key factors to watch. Despite higher borrowing costs, Scottsdale’s stable pricing and price per square foot suggest the market remains healthy across multiple price categories, with the luxury segment providing an additional boost rather than masking weakness elsewhere. If inventory continues to tighten, the market could gain momentum as we move through the summer months.
– Grant Van Dyke
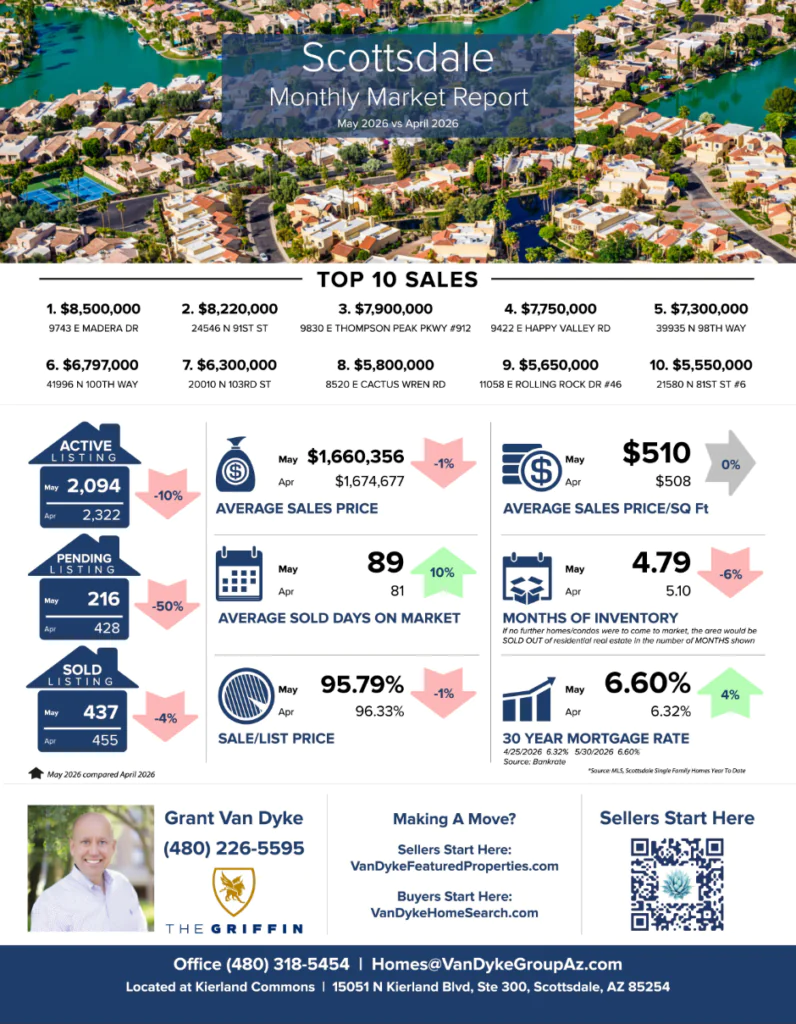
Scottsdale
Average Sales Price: April 2026 > $1,674,677 vs May 2026 > $1,660,356 = 1% decrease
Average Days On Market: April 2026 > 81 vs May 2026 > 89 = 10% increase
Average Sale Price Per Square Foot: April 2026 > $508 vs May 2026 > $510 = 0% change
Sale to List Price Ratio: April 2026 > 96.33% vs May 2026 > 95.79% = 1% decrease
Number of Sold Listings: April 2026 > 455 vs May 2026 > 437 = 4% decrease
Months Supply of Inventory: April 2026 > 5.1 vs May 2026 > 4.79 = 6% decrease
Mortgage Rate: April 2026 > 6.32% vs May 2026 > 6.60% = 4% increase
Top 10 Sales
$8,500,000 9743 E Madera Dr
$8,220,000 24546 N 91st St
$7,900,000 9830 E Thompson Peak Pkwy #912
$7,750,000 9422 E Happy Valley Rd
$7,300,000 39935 N 98th Way
$6,797,000 41996 N 100th Way
$6,300,000 20010 N 103rd St
$5,800,000 8520 E Cactus Wren Rd
$5,650,000 11058 E Rolling Rock Dr #46
$5,550,000 21580 N 81st St #6
GRAB OUR FREE COURSES
➡️ 6 Steps To Home Buyer Success – http://vandykebuyerplan.com
➡️ 7 Steps To Home Seller Plan – http://vandykesellerplan.com
➡️ 8 Steps To Agent Success – http://vandykeagentplan.com


