 See photos and updates from listings directly in your feed
 Share your favorite listings with friends and family
 Save your search and get new listings directly in your mailbox before everybody else
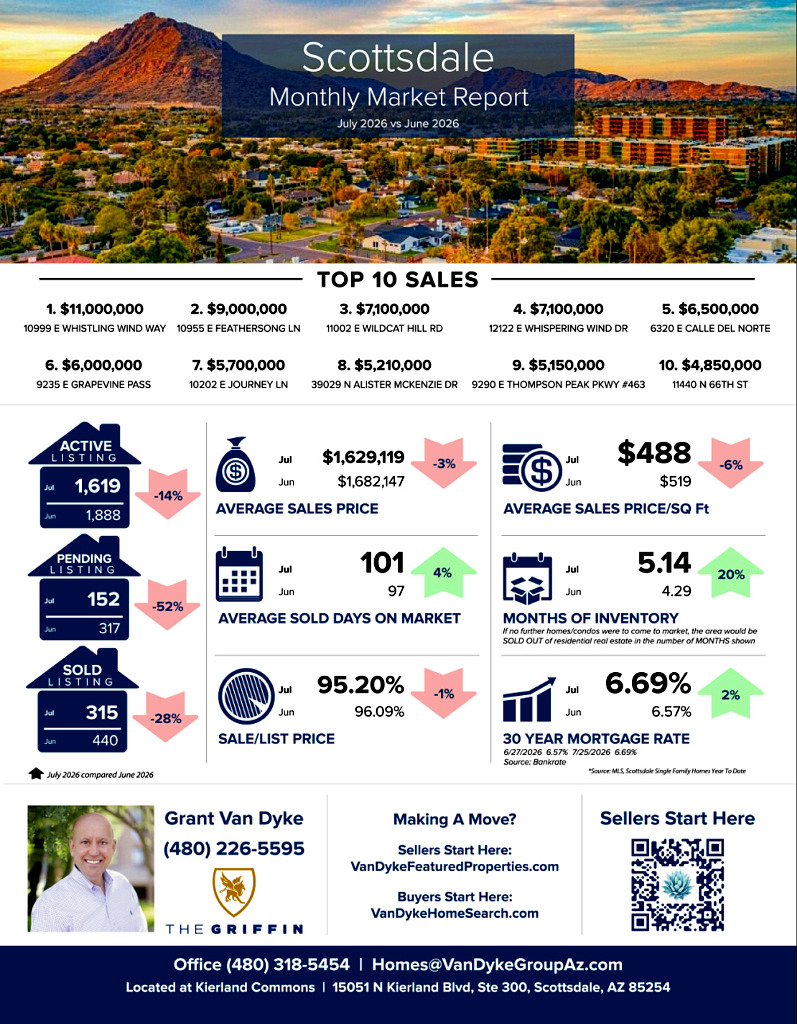
In the coming months, it’s important to watch whether inventory continues to grow, as more homes on the market could give buyers additional negotiating power. Mortgage rates will remain the biggest driver of buyer activity, with even small changes influencing affordability and the pace of sales. Finally, sellers who price their homes competitively are likely to outperform the market, as today’s buyers have more choices and are becoming increasingly selective.
– Grant Van Dyke
Scottsdale
Average Sales Price: June 2026 > $1,682,147 vs July 2026 > $1,629,119 = 3% decrease
Average Days On Market: June 2026 > 97 vs July 2026 > 101 = 4% increase
Average Sale Price Per Square Foot: June 2026 > $519 vs July 2026 > $488 = 6% decrease
Sale to List Price Ratio: June 2026 > 96.09% vs July 2026 > 95.20% = 1% decrease
Number of Sold Listings: June 2026 > 440 vs July 2026 > 315 = 28% decrease
Months Supply of Inventory: June 2026 > 4.29 vs July 2026 > 5.14 = 20% increase
Mortgage Rate: June 2026 > 6.57% vs July 2026 > 6.69% = 2% increase
Top 10 Sales
$11,000,000 10999 E Whistling Wind Way
$9,000,000 10955 E Feathersong Ln
$7,100,000 11002 E Wildcat Hill Rd
$7,100,000 12122 E Whispering Wind Dr
$6,500,000 6320 E Calle Del Norte
$6,000,000 9235 E Grapevine Pass
$5,700,000 10202 E Journey Ln
$5,210,000 39029 N Alister Mckenzie Dr
$5,150,000 9290 E Thompson Peak Pkwy #463
$4,850,000 11440 N 66th St
GRAB OUR FREE COURSES
➡️ 6 Steps To Home Buyer Success – http://vandykebuyerplan.com
➡️ 7 Steps To Home Seller Plan – http://vandykesellerplan.com
➡️ 8 Steps To Agent Success – http://vandykeagentplan.com