 See photos and updates from listings directly in your feed
 Share your favorite listings with friends and family
 Save your search and get new listings directly in your mailbox before everybody else
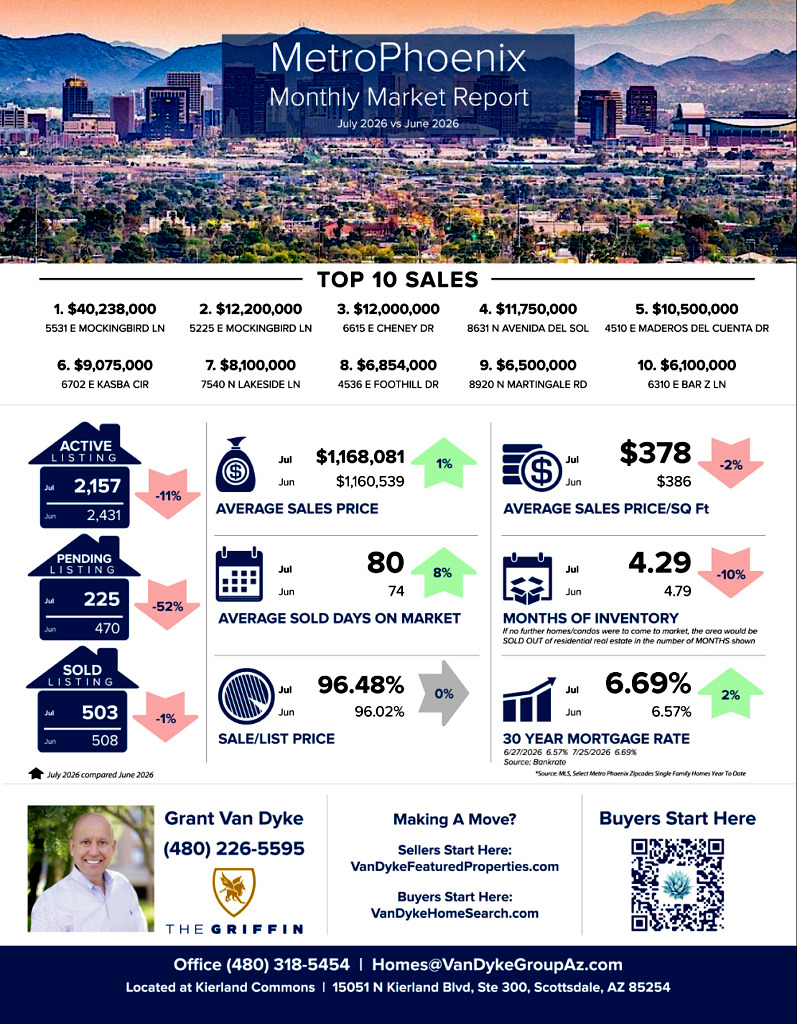
In the coming months, it’s important to watch whether inventory continues to tighten after July’s 10% decline, as this could place renewed upward pressure on home prices. Mortgage rates will remain the biggest factor influencing affordability and buyer activity. If borrowing costs stabilize while inventory remains limited, Metro Phoenix is positioned to continue experiencing a balanced market with steady pricing through the remainder of the summer and into early fall.
– Grant Van Dyke
Metro Phoenix
Average Sales Price: June 2026 > $1,160,539 vs July 2026 > $1,168,081 = 1% increase
Average Days On Market: June 2026 > 74 vs July 2026 > 80 = 8% increase
Average Sale Price Per Square Foot: June 2026 > $386 vs July 2026 > $378 = 2% decrease
Sale to List Price Ratio: June 2026 > 96.02% vs July 2026 > 96.48% = 0% Change
Number of Sold Listings: June 2026 > 508 vs July 2026 > 503 = 1% decrease
Months Supply of Inventory: June 2026 > 4.79 vs July 2026 > 4.29 = 10% decrease
Mortgage Rate: June 2026 > 6.57% vs July 2026 > 6.69% = 2% increase
Top 10 Sales
$40,238,000 5531 E Mockingbird Ln, Paradise Valley
$12,200,000 5225 E Mockingbird Ln, Paradise Valley
$12,000,000 6615 E Cheney Dr, Paradise Valley
$11,750,000 8631 N Avenida Del Sol –, Paradise Valley
$10,500,000 4510 E Maderos del Cuenta Dr, Paradise Valley
$9,075,000 6702 E Kasba Cir, Paradise Valley
$8,100,000 7540 N Lakeside Ln, Paradise Valley
$6,854,000 4536 E Foothill Dr, Paradise Valley
$6,500,000 8920 N Martingale Rd, Paradise Valley
$6,100,000 6310 E Bar Z Ln, Paradise Valley
GRAB OUR FREE COURSES
➡️ 6 Steps To Home Buyer Success – http://vandykebuyerplan.com
➡️ 7 Steps To Home Seller Plan – http://vandykesellerplan.com
➡️ 8 Steps To Agent Success – http://vandykeagentplan.com