 See photos and updates from listings directly in your feed
 Share your favorite listings with friends and family
 Save your search and get new listings directly in your mailbox before everybody else
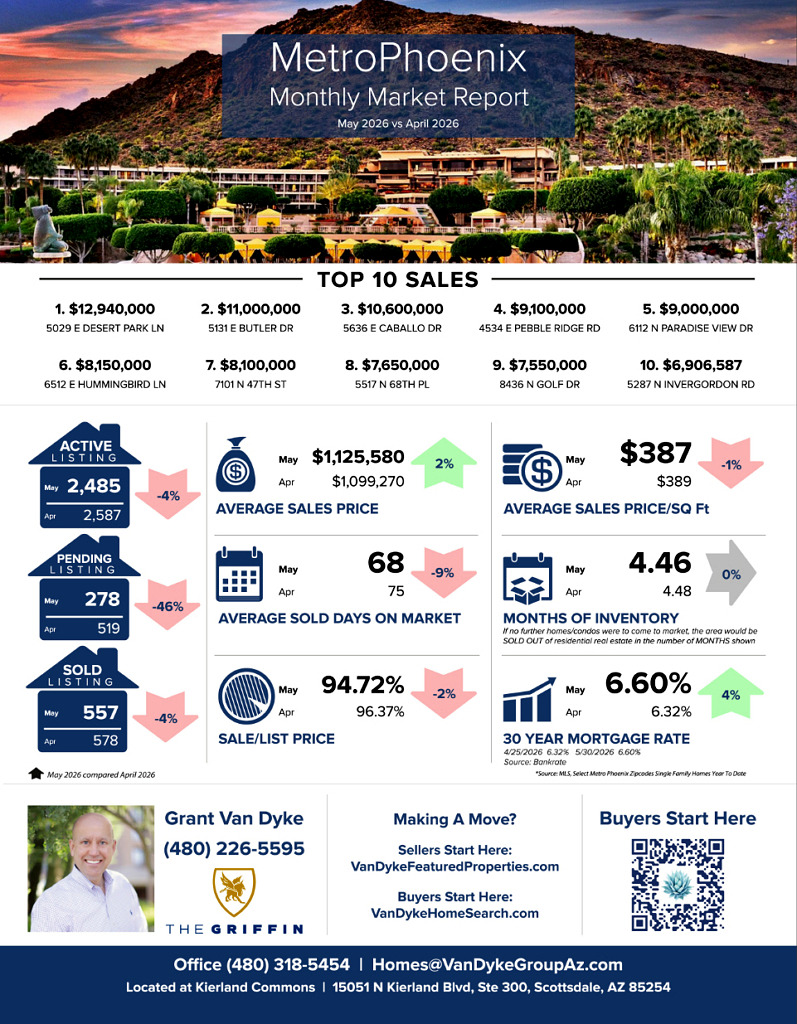
In the coming months, it’s important to watch whether mortgage rates continue to rise or begin to stabilize, as this will have a direct impact on buyer activity. Even with higher rates, the number of homes available for sale has remained steady and home prices have continued to hold firm, suggesting buyers are still actively participating in the market. For now, Metro Phoenix remains a balanced market, giving buyers more choices than we’ve seen in recent years while allowing well-priced homes to continue attracting interest.
– Grant Van Dyke
Metro Phoenix
Average Sales Price: April 2026 > $1099270 vs May 2026 > $1125580 = 2% increase
Average Days On Market: April 2026 > 75 vs May 2026 > 68 = 9% decrease
Average Sale Price Per Square: Foot April 2026 > $389 vs May 2026 > $387 = 1% decrease
Sale to List Price Ratio: April 2026 > 96.37% vs May 2026 > 94.72% = 2% decrease
Number of Sold Listings: April 2026 > 578 vs May 2026 > 557 = 4% decrease
Months Supply of Inventory: April 2026 > 4.48 vs May 2026 > 4.46 = 0% change
Mortgage Rate: April 2026 > 6.32%vs May 2026 > 6.60% = 4% increase
Top 10 Sales
$12,940,000 5029 E Desert Park Ln, Paradise Valley
$11,000,000 5131 E Butler Dr, Paradise Valley
$10,600,000 5636 E Caballo Dr, Paradise Valley
$9,100,000 4534 E Pebble Ridge Rd, Paradise Valley
$9,000,000 6112 N Paradise View Dr, Paradise Valley
$8,150,000 6512 E Hummingbird Ln, Paradise Valley
$8,100,000 7101 N 47th St, Paradise Valley
$7,650,000 5517 N 68th Pl, Paradise Valley
$7,550,000 8436 N Golf Dr, Paradise Valley
$6,906,587 5287 N Invergordon Rd, Paradise Valley
GRAB OUR FREE COURSES
➡️ 6 Steps To Home Buyer Success – http://vandykebuyerplan.com
➡️ 7 Steps To Home Seller Plan – http://vandykesellerplan.com
➡️ 8 Steps To Agent Success – http://vandykeagentplan.com