
In the coming months, it’s important to watch for signs of renewed buyer activity if mortgage rates begin to ease from current levels. Inventory remains elevated, but softening prices, especially in the mid-to-luxury tier, may not last if demand picks up. Buyers currently have the upper hand, but that window could narrow quickly with any shift in rates or seasonal momentum.
– Grant Van Dyke
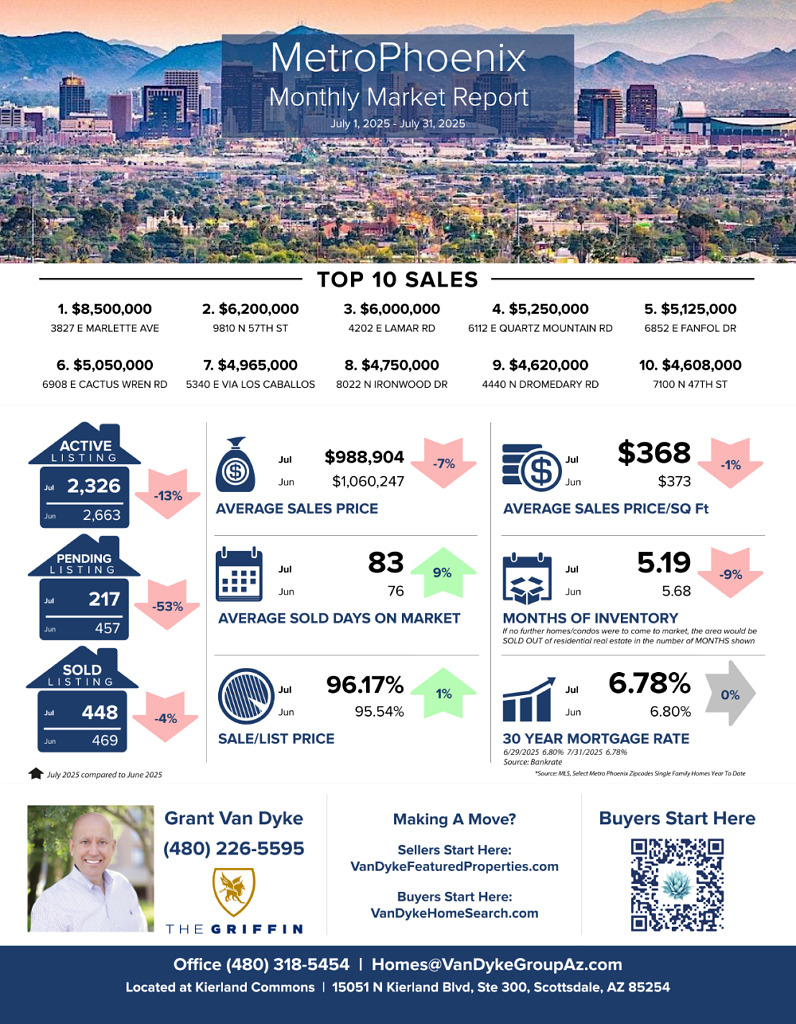
Metro Phoenix
Average Sales Price: June 2025 > $1060247 vs July 2025 > $988904 = 7% decrease
Average Days On Market: June 2025 > 76 vs July 2025 > 83 = 9% increase
Average Sale Price Per Square Foot: June 2025 > $373 vs July 2025 > $368 = 1% decrease
Sale to List Price Ratio: June 2025 > 95.54% vs July 2025 > 96.17% = 1% increase
Number of Sold Listings: June 2025 > 469 vs July 2025 > 448 = 4% decrease
Months Supply of Inventory: June 2025 > 5.68 vs July 2025 > 5.19 = 9% decrease
Mortgage Rate: June 2025 > 6.80% vs July 2025 > 6.78% = 0%
Top 10 Sales
$8,500,000 3827 E Marlette Ave, Paradise Valley
$6,200,000 9810 N 57th St, Paradise Valley
$6,000,000 4202 E Lamar Rd, Paradise Valley
$5,250,000 6112 E Quartz Mountain Rd, Paradise Valley
$5,125,000 6852 E Fanfol Dr, Paradise Valley
$5,050,000 6908 E Cactus Wren Rd, Paradise Valley
$4,965,000 5340 E Via Los Caballos, Paradise Valley
$4,750,000 8022 N Ironwood Dr, Paradise Valley
$4,620,000 4440 N Dromedary Rd, Phoenix
$4,608,000 7100 N 47th St, Paradise Valley
GRAB OUR FREE COURSES
➡️ 6 Steps To Home Buyer Success – http://vandykebuyerplan.com
➡️ 7 Steps To Home Seller Plan – http://vandykesellerplan.com
➡️ 8 Steps To Agent Success – http://vandykeagentplan.com


