
The market continues to improve for sellers. Sold properties are up 34% over January 2023; this increase is much more positive than the industry expected in the fourth quarter of 2022. The contract ratio for all areas & types has risen above 60% as of March 1st, showing signs of a market heating up again. You should anticipate seeing house prices rise over the coming months, no matter what you hear or read in the media. This is because the media tends to base their reports and projections on lagging housing data, such as the S&P Case-Shiller® Home Price Index®.
– Grant Van Dyke
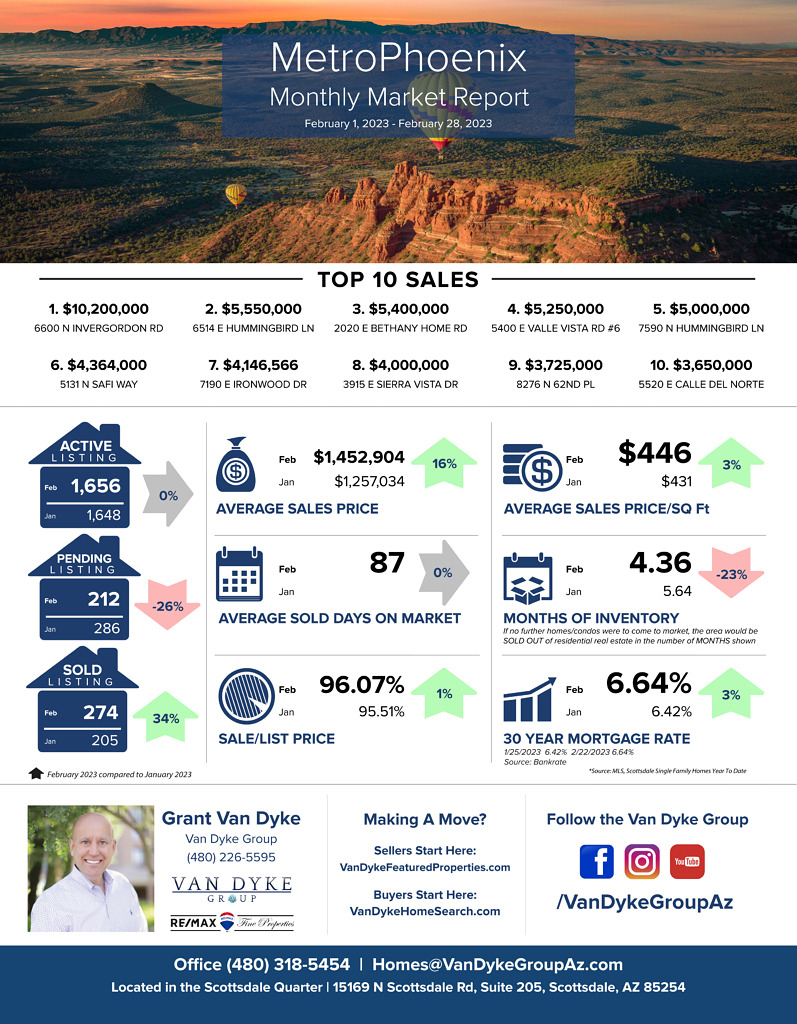
Metro Phoenix
Average Sales Price: January 2023 > $954,030 vs February 2023 > $885,591 = 7% decrease
Average Days On Market: January 2023 > 80 vs February 2023 > 87 = 9% increase
Average Sale Price Per Square Foot: January 2023 > $341 vs February 2023 > $341 = 0% Change
Sale to List Price Ratio: January 2023 > 94.53% vs February 2023 > 96.16% = 2% increase
Number of Sold Listings: January 2023 > 337 vs February 2023 > 425 = 26% increase
Months Supply of Inventory: January 2023 > 5.64 vsFebruary 2023 > 4.36 = 23% decrease
Mortgage Rate: January 2023 > 6.42% vs February 2023 > 6.64% = 3% increase
Top 10 Sales
$10,200,000 6600 N Invergordon Rd, Paradise Valley
$5,550,000 6514 E Hummingbird Ln, Paradise Valley
$5,400,000 2020 E Bethany Home Rd, Phoenix
$5250,000 5400 E Valle Vista Rd #6, Phoenix
$5,000,000 7590 N Hummingbird Ln, Paradise Valley
$4,364,000 5131 N Safi Way, Paradise Valley
$4,146,566 7190 E Ironwood Dr, Paradise Valley
$4,000,000 3915 E Sierra Vista Dr, Paradise Valley
$3,725,000 8276 N 62nd Pl, Paradise Valley
$3,650,000 5520 E Calle del Norte, Phoenix


