
The 19% drop in average sales price is a headline-grabbing shift; however, it’s largely driven by the luxury market rebalancing and price sensitivity, not a collapse in demand. MetroPhoenix is transitioning from a seller-leaning market to a balanced market. While steady mortgage rates may keep the market measured and negotiation-driven. Sellers need to price strategically and present their home competitively, as buyers now have more options, greater leverage, and are less willing to overpay in a more balanced market.
– Grant Van Dyke
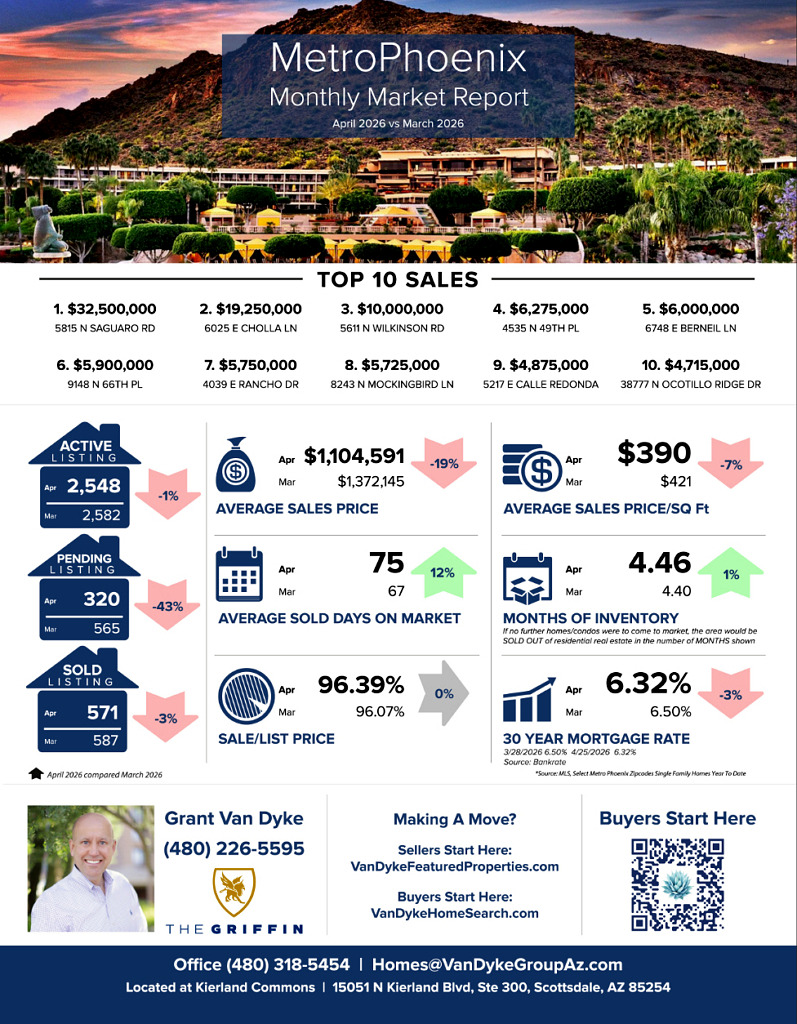
Metro Phoenix
Average Sales Price: March 2026 > $1,372,145 vs April 2026 > $1,104,591 = 19% decrease
Average Days On Market: March 2026 > 67 vs April 2026 > 75 = 12% increase
Average Sale Price Per Square Foot: March 2026 > $421 vs April 2026 > $390 = 7% decrease
Sale to List Price Ratio: March 2026 > 96.07% vs April 2026 > 96.39% = 0% change
Number of Sold Listings: March 2026 > 587 vs April 2026 > 571 = 3% decrease
Months Supply of Inventory: March 2026 > 4.4 vs April 2026 > 4.46 = 1% increase
Mortgage Rate: March 2026 > 6.50% vs April 2026 > 6.32% = 3% decrease
Top 10 Sales
$32,500,000 5815 N Saguaro Rd, Paradise Valley
$19,250,000 6025 E Cholla Ln, Paradise Valley
$10,000,000 5611 N Wilkinson Rd, Paradise Valley
$6,275,000 4535 N 49th Pl, Phoenix
$6,000,000 6748 E Berneil Ln, Paradise Valley
$5,900,000 9148 N 66th Pl, Paradise Valley
$5,750,000 4039 E Rancho Dr, Phoenix
$5,725,000 8243 N Mockingbird Ln, Paradise Valley
$4,875,000 5217 E Calle Redonda, Phoenix
$4,715,000 38777 N Ocotillo Ridge Dr, Carefree
GRAB OUR FREE COURSES
➡️ 6 Steps To Home Buyer Success – http://vandykebuyerplan.com
➡️ 7 Steps To Home Seller Plan – http://vandykesellerplan.com
➡️ 8 Steps To Agent Success – http://vandykeagentplan.com


