
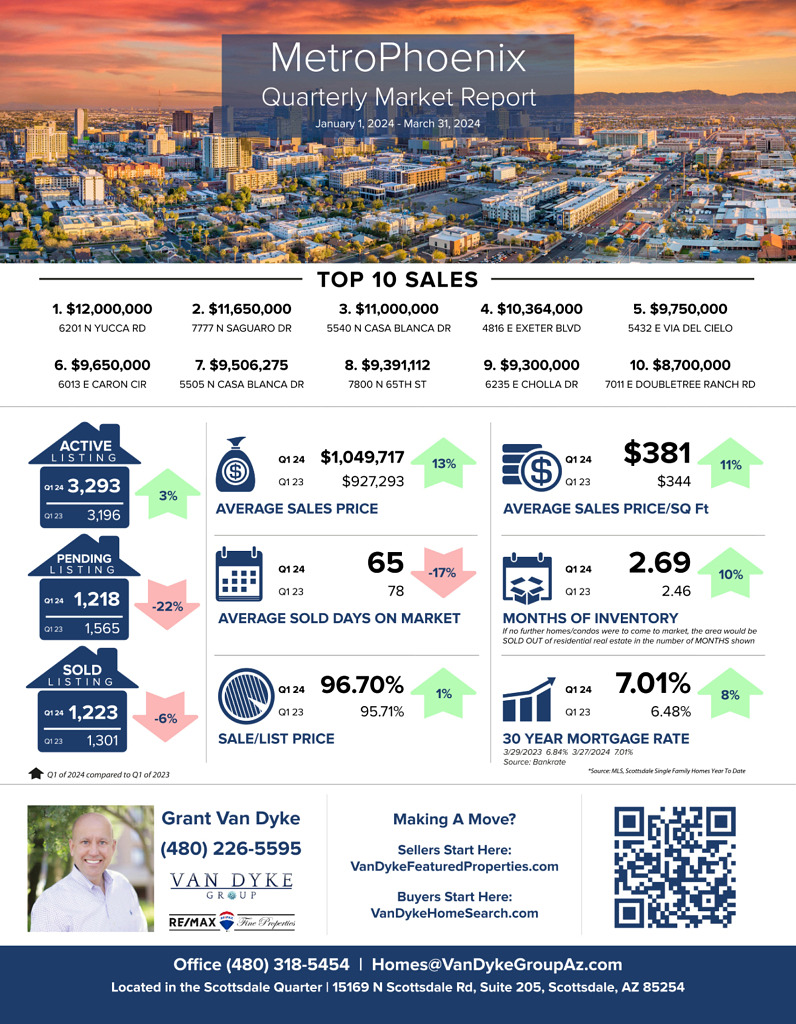
In Quarter 1, 2024, Metro Phoenix saw a 6% drop in Sold properties compared to Quarter 1, 2023, yet Average Sales prices increased by 13%. Despite this, Inventory rose, offering homebuyers more choices and bargaining power. As we enter Quarter 2, our seasonally strong period for sales, attention turns to potential rate cuts by the Federal Reserve. The timing and extent of these cuts hinge on factors like inflation and employment. The median prediction among Fed officials remains at three rate cuts for 2024. Time… Inflation… & Employment will tell.
– Grant Van Dyke
Metro Phoenix
Average Sales Price: Q1 2023 > $927,293 vs Q1 2024 > $1,049,717 = 13% increase
Average Days On Market: Q1 2023 > 78 vs Q1 2024 > 65 = 17% decrease
Average Sale Price Per Square Foot: Q1 2023 > $344 vs Q1 2024 > $381 = 11% increase
Sale to List Price Ratio: Q1 2023 > 95.71% vs Q1 2024 > 96.70% = 1% increase
Number of Sold Listings: Q1 2023 > 1301 vs Q1 2024 > 1223 = 6% decrease
Months Supply of Inventory: Q1 2023 > 2.46 vs Q1 2024 > 2.69 = 10% increase
Mortgage Rate: Q1 2023 > 6.48% vs Q1 2024 > 7.01% = 8% increase
Top 10 Sales
$12,000,000 6201 N Yucca Rd, Paradise Valley
$11,650,000 7777 N Saguaro Dr, Paradise Valley
$11,000,000 5540 N Casa Blanca Dr, Paradise Valley
$10,364,000 4816 E Exeter Blvd, Phoenix
$9,750,000 5432 E Via Del Cielo, Paradise Valley
$9,650,000 6013 E Caron Cir, Paradise Valley
$9,506,275 5505 N Casa Blanca Dr, Paradise Valley
$9,391,112 7800 N 65th St, Paradise Valley
$9,300,000 6235 E Cholla Dr, Paradise Valley
$8,700,000 7011 E Doubletree Ranch Rd, Paradise Valley


