
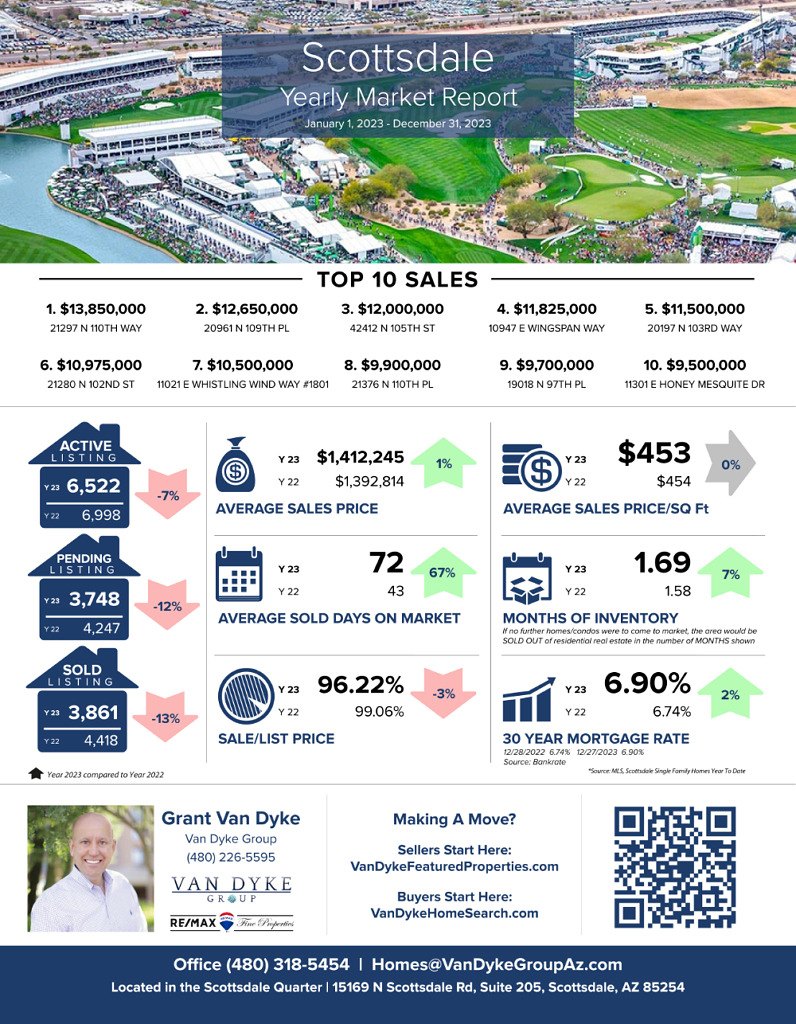
A 13% decrease in SOLD properties reflects reduced demand and market activity. Despite this decline, the Average Sales Price Increased by a modest 1%, while the Average Price Per square foot remained stable, indicating consistent pricing dynamics. The rise in available homes for sale suggests a shift toward a more balanced market. However, with interest rates dropping below 7%, as the Scottsdale home selling season gains momentum, we anticipate a market slightly favoring sellers. Effective marketing, exposure, and agent representation become crucial for sellers and buyers in such markets.
– Grant Van Dyke
Scottsdale
Average Sales Price: 2022 > $1,392,814 vs 2023 > $1,412,245 = 1% increase
Average Days On Market: 2022 > 43 vs 2023 > 72 = 67% increase
Average Sale Price Per Square Foot: 2022 > $454 vs 2023 > $453 = 0% No Change
Sale to List Price Ratio: 2022 > 99.06% vs 2023 > 96.22% = 3% decrease
Number of Sold Listings: 2022 > 4,418 vs 2023 > 3,861 = 13% decrease
Months Supply of Inventory: 2022 > 1.58 vs 2023 > 1.69 = 7% increase
Mortgage Rate: 2022 > 6.74% vs 2023 > 6.90% = 2% increase
Top 10 Sales
$13,850,000 21297 N 110th Way
$12,650,000 20961 N 109th Place
$12,000,000 42412 N 105th St
$11,825,000 10947 E Wingspan Way
$11,500,000 20197 N 103rd Way
$10,975,000 21280 N 102nd St
$10,500,000 11021 E Whistling Wind Way #1801
$9,900,000 21376 N 110th Place
$9,700,000 19018 N 97th Place
$9,500,000 11301 E Honey Mesquite Dr


