In the coming months, it’s important to watch whether buyer activity continues to build, as rising mortgage rates have already driven a 8% increase in sales and could further accelerate demand. It will also be critical to monitor price momentum, especially in the luxury segment, where strong demand is continuing to push average values higher. Finally, keep an eye on inventory levels, as with supply still below 3 months, even small shifts could quickly affect negotiating power and overall market balance.
– Grant Van Dyke
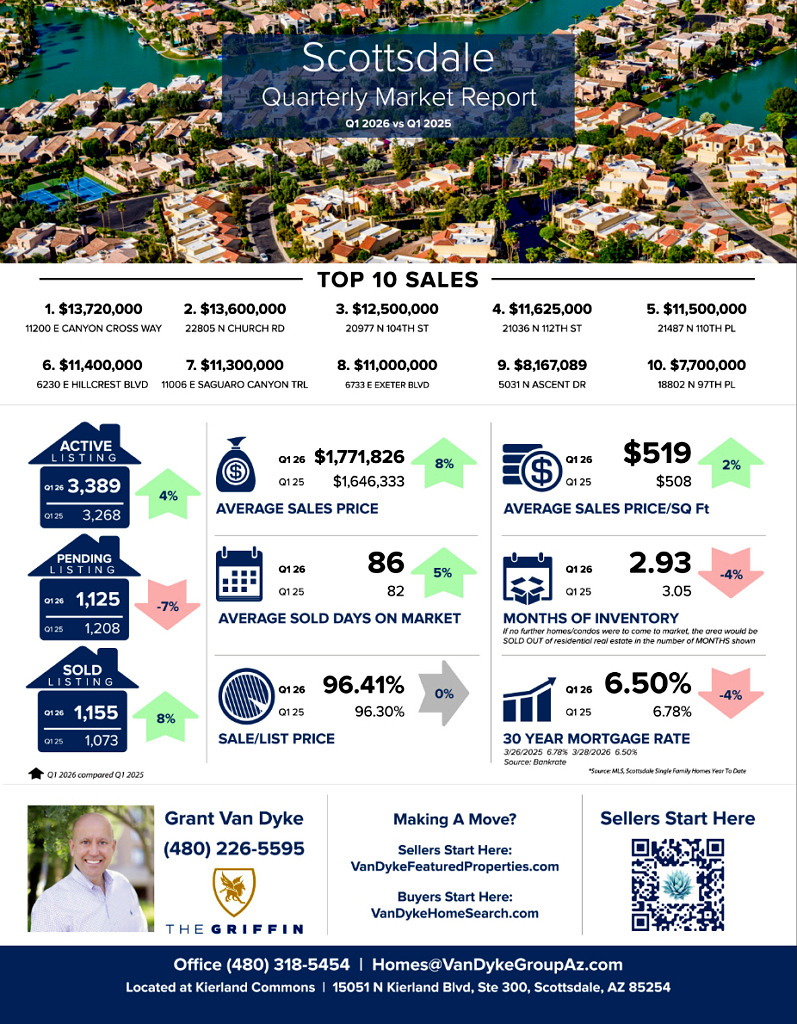
Scottsdale
Average Sales Price: Q1 2026 > $1,771,826 vs Q1 2025 > $1,646,333 = 8% increase
Average Days On Market: Q1 2026 > 86 vs Q1 2025 > 82 = 5% increase
Average Sale Price Per Square Foot: Q1 2026 > $519 vs Q1 2025 > $508 = 8% increase
Sale to List Price Ratio: Q1 2026 > 96.41% vs Q1 2025 > 96.30% = 0% No Change
Number of Sold Listings: Q1 2026 > 1155 vs Q1 2025 > 1073 = 8% increase
Months Supply of Inventory: Q1 2026 > 2.93 vs Q1 2025 > 3.05 = 4% decrease
Mortgage Rate: Q1 2026 > 6.50% vs Q1 2025 > 6.78% = 4% decrease
Top 10 Sales
$13,720,000 11200 E Canyon Cross Way
$13,600,000 22805 N Church Road
$12,500,000 20977 N 104th Street
$11,625,000 21036 N 112th Street
$11,500,000 21487 N 110th Place
$11,400,000 6230 E Hillcrest Boulevard
$11,300,000 11006 E Saguaro Canyon Trail
$11,000,000 6733 E Exeter Boulevard
$8,167,089 5031 N Ascent Drive
$7,700,000 18802 N 97th Place
GRAB OUR FREE COURSES
➡️ 6 Steps To Home Buyer Success – http://vandykebuyerplan.com
➡️ 7 Steps To Home Seller Plan – http://vandykesellerplan.com
➡️ 8 Steps To Agent Success – http://vandykeagentplan.com


