In the coming months, it’s important to watch how renewed buyer momentum interacts with falling mortgage rates, as October’s 14% jump in sales suggests more activity ahead. Even with prices holding steady, the rise in price per square foot suggests that buyers are prioritizing quality over size, a trend that could intensify as inventory becomes tighter. With supply now at just over five months, sellers hold a slight advantage; however, the balance could shift quickly if more listings return to the market in early 2026.
– Grant Van Dyke
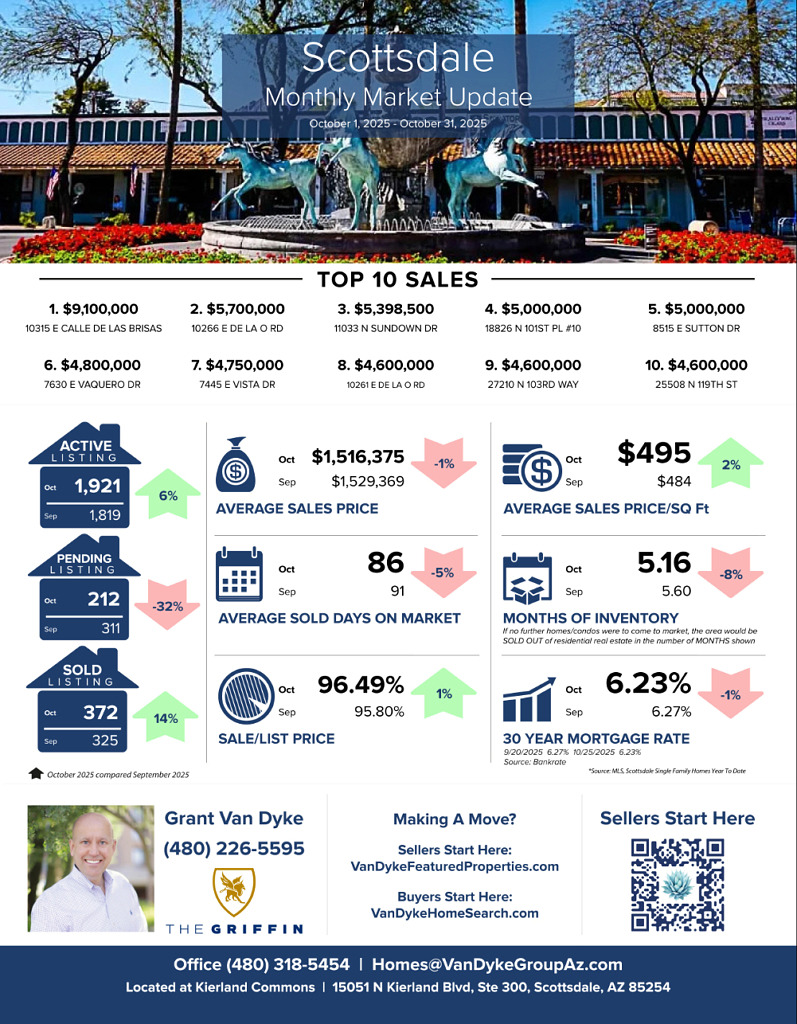
Scottsdale
Average Sales Price: September 2025 > $1529369 vs October 2025 > $1516375 = 1% decrease
Average Days On Market: September 2025 > 91 vs October 2025 > 86 = 5% decrease
Average Sale Price Per Square Foot: September 2025 > $484 vs October 2025 > $495 = 2% increase
Sale to List Price Ratio: September 2025 > 95.80% vs October 2025 > 96.49% = 1% increase
Number of Sold Listings: September 2025 > 325 vs October 2025 > 372 = 14% increase
Months Supply of Inventory: September 2025 > 5.6 vs October 2025 > 5.16 = 8% decrease
Mortgage Rate: September 2025 > 6.27% vs October 2025 > 6.23% = 1% decrease
Top 10 Sales
$9,100,000 10315 E Calle De Las Brisas
$5,700,000 10266 E De La O Rd
$5,398,500 11033 N Sundown Dr
$5,000,000 18826 N 101st Pl #10
$5,000,000 8515 E Sutton Dr
$4,800,000 7630 E Vaquero Dr
$4,750,000 7445 E Vista Dr
$4,600,000 10261 E De La O Rd
$4,600,000 27210 N 103rd Way
$4,600,000 25508 N 119th St
GRAB OUR FREE COURSES
➡️ 6 Steps To Home Buyer Success – http://vandykebuyerplan.com
➡️ 7 Steps To Home Seller Plan – http://vandykesellerplan.com
➡️ 8 Steps To Agent Success – http://vandykeagentplan.com


