
The 2% decrease in the number of sold listings to 416 units, along with the luxury market continuing to hold a steady pace, has impacted the Metro Phoenix market dynamics. This decline contributed to a 3% decrease in the Average Sales Price, while the Average Price Per square foot remained steady at $376 per square foot. Furthermore, the 8% increase in the inventory of available properties, measured in months supply, to 4.03 months may have been influenced by the 6% rise in mortgage rates, reaching 8.01% according to Bank Rate.com, affecting the overall housing market. Open House activity is up, pointing to Buyers wanting to get off the sidelines and to go shopping for that new home.
– Grant Van Dyke
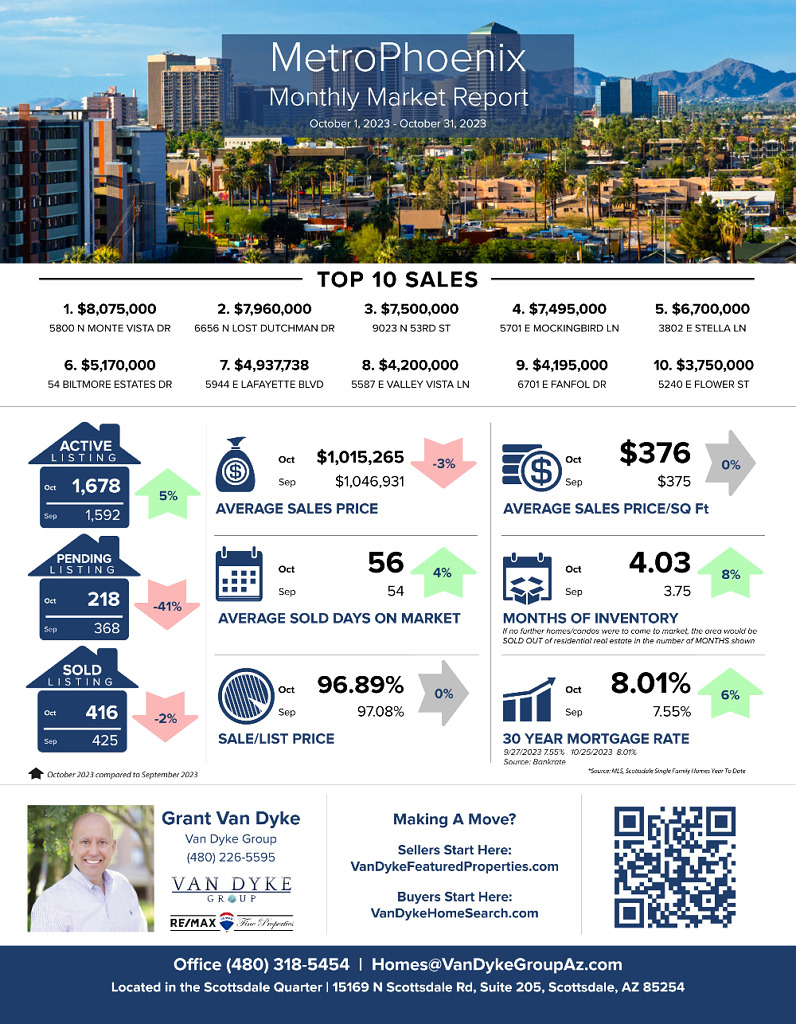
Metro Phoenix
Average Sales Price: September 2023 > $1,046,931 vs October 2023 > $1,015,265 = 3% decrease
Average Days On Market: September 2023 > 54 vs October 2023 > 56 = 4% increase
Average Sale Price Per Square Foot: September 2023 > $375 vs October 2023 > $376 = 0% No Change
Sale to List Price Ratio: September 2023 > 97.08% vs October 2023 > 96.89% = 0% No Change
Number of Sold Listings: September 2023 > 425 vs October 2023 > 416 = 2% decrease
Months Supply of Inventory: September 2023 > 3.75 vs October 2023 > 4.03 = 8% increase
Mortgage Rate: September 2023 > 7.55% vs October 2023 > 8.01% = 6% increase
Top 10 Sales
$8,075,000 5800 N Monte Vista Dr, Paradise Valley
$7,960,000 6656 N Lost Dutchman Dr, Paradise Valley
$7,500,000 9023 N 53rd St, Paradise Valley
$7,495,000 5701 E Mockingbird Ln, Paradise Valley
$6,700,000 3802 E Stella Ln, Paradise Valley
$5,170,000 54 Biltmore Estates Dr, Phoenix
$4,937,738 5944 E Lafayette Blvd, Phoenix
$4,200,000 5587 E Valley Vista Ln, Paradise Valley
$4,195,000 6701 E Fanfol Dr, Paradise Valley
$3,750,000 5240 E Flower St, Phoenix


