In the coming months, it’s important to watch whether lower mortgage rates, now below 6%, continue to bring more buyers into the market and sustain the recent surge in sales activity. It will also be critical to monitor inventory levels, as the sharp drop in available homes could increase competition and shift more negotiating power toward sellers, if supply remains tight. Finally, keep an eye on pricing trends. Recent price changes reflect what’s selling rather than weakening values. Continued demand and limited inventory could begin putting upward pressure on home prices again as we move deeper into the spring market.
– Grant Van Dyke
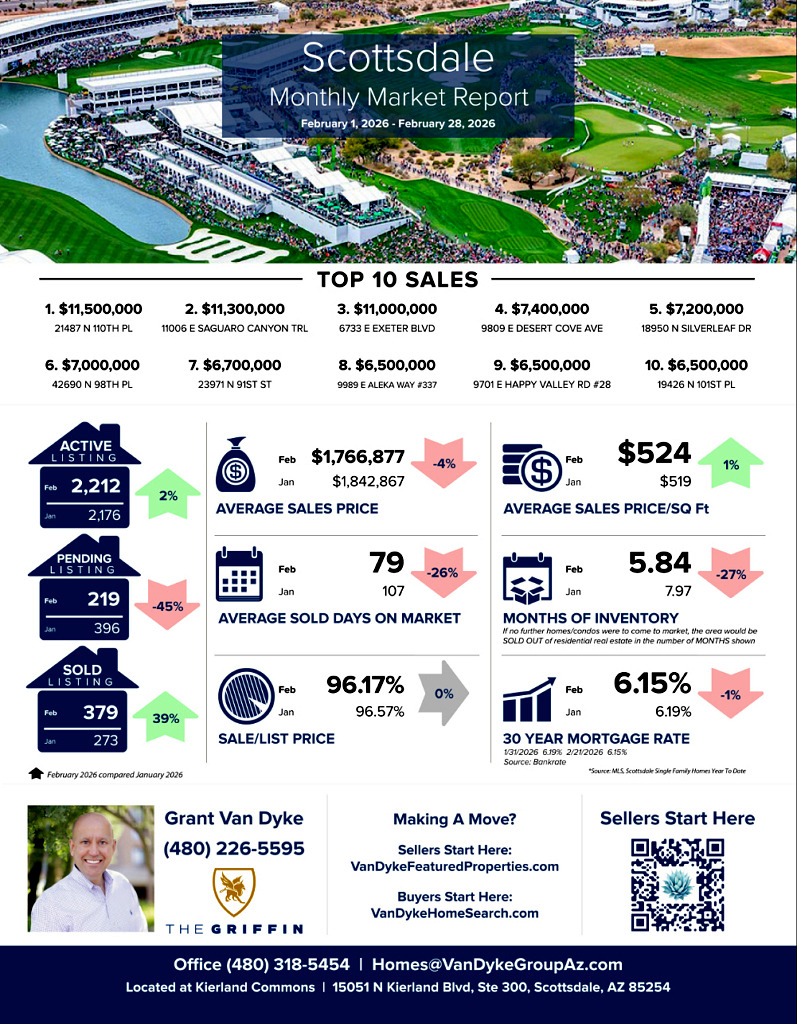
Scottsdale
Average Sales Price: January 2026 > $1,842,867 vs February 2026 > $1,766,877 = 4% decrease
Average Days On Market: January 2026 > 107 vs February 2026 > 79 = 26% decrease
Average Sale Price Per Square Foot: January 2026 > $519 vs February 2026 > $524 = 1% increase
Sale to List Price Ratio: January 2026 > 96.57% vs February 2026 > 96.17% = 0% change
Number of Sold Listings: January 2026 > 273 vs February 2026 > 379 = 39% increase
Months Supply of Inventory: January 2026 > 7.97 vs February 2026 > 5.84 = 27% decrease
Mortgage Rate: January 2026 > 6.19% vs February 2026 > 6.15% = 1% decrease
Top 10 Sales
$11,500,000 21487 N 110th Place
$11,300,000 11006 E Saguaro Canyon Trl
$11,000,000 6733 E Exeter Blvd
$7,400,000 9809 E Desert Cove Ave
$7,200,000 18950 N Silverleaf Dr
$7,000,000 42690 N 98th Place
$6,700,000 23971 N 91st Street
$6,500,000 9989 E Aleka Way #337
$6,500,000 9701 E Happy Valley Rd #28
$6,500,000 19426 N 101st Place
GRAB OUR FREE COURSES
➡️ 6 Steps To Home Buyer Success – http://vandykebuyerplan.com
➡️ 7 Steps To Home Seller Plan – http://vandykesellerplan.com
➡️ 8 Steps To Agent Success – http://vandykeagentplan.com


