
The 16% drop in average home prices and 13% increase in sales show buyers are gaining the upper hand in negotiations. Solid property options are still available with inventory tightening by 9%, but motivated sellers may be more willing to negotiate. Plus, with mortgage rates down to 6.84%, buyers can secure a better deal before competition picks up.
– Grant Van Dyke
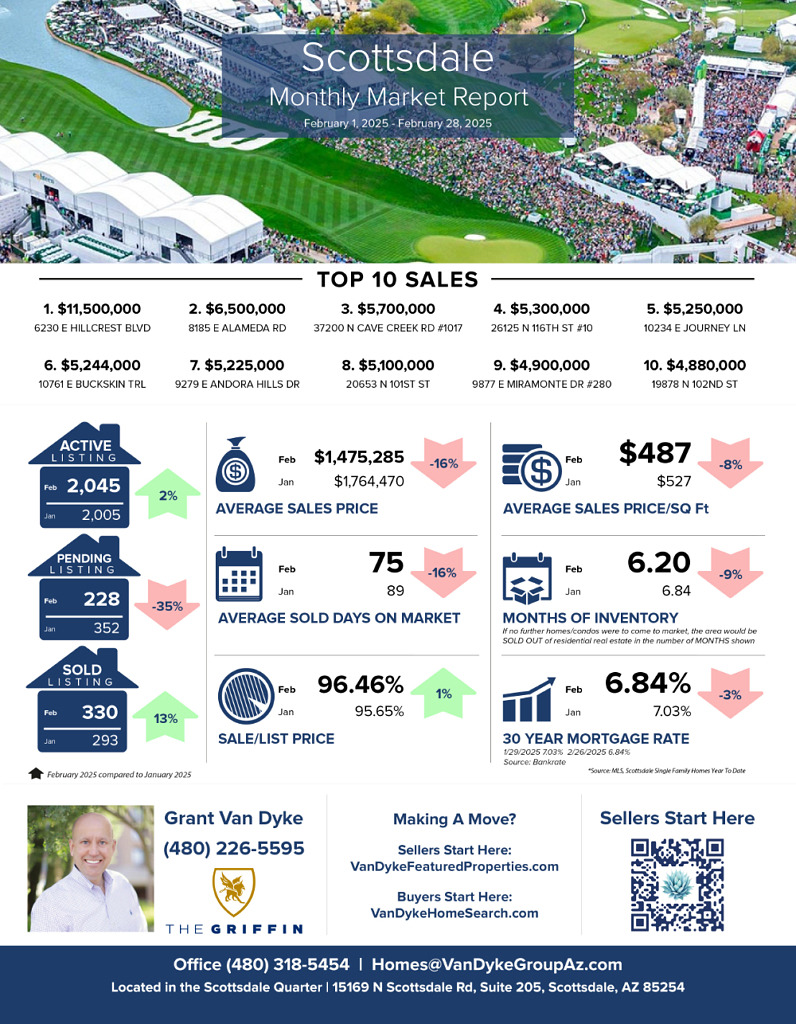
Scottsdale
Average Sales Price: January 2025 > $1,764,470 vs February 2025 > $1,475,285 = 16% decrease
Average Days On Market: January 2025 > 89 vs February 2025 > 75 = 16% decrease
Average Sale Price Per Square Foot: January 2025 > $527 vs February 2025 > $487 = 8% decrease
Sale to List Price Ratio: January 2025 > 95.65% vs February 2025 > 96.46% = 1% increase
Number of Sold Listings: January 2025 > 293 vs February 2025 > 330 = 13% increase
Months Supply of Inventory: January 2025 > 6.84 vs February 2025 > 6.2 = 9% decrease
Mortgage Rate: January 2025 > 7.03% vs February 2025 > 6.84% = 3% decrease
Top 10 Sales
$11,500,000 6230 E Hillcrest Blvd
$6,500,000 8185 E Alameda Rd
$5,700,000 37200 N Cave Creek Rd #1017
$5,300,000 26125 N 116th St #10
$5,250,000 10234 E Journey Ln
$5,244,000 10761 E Buckskin Trl
$5,225,000 9279 E Andora Hills Dr
$5,100,000 20653 N 101st St
$4,900,000 9877 E Miramonte Dr #280
$4,880,000 19878 N 102nd St
GRAB OUR FREE COURSES
- 6 Steps To Home Buyer Success – http://vandykebuyerplan.com
- 7 Steps To Home Seller Plan – http://vandykesellerplan.com
- 8 Steps To Agent Success – http://vandykeagentplan.com


