In the coming months, it’s important to watch whether buyer demand continues to hold now that prices remain elevated but mortgage rates have eased, as Scottsdale’s 7% increase in sales suggests buyers are still willing to act when value aligns with pricing. Inventory levels will be critical, as months of supply near 1.8 continue to support prices, but any sustained increase could quickly shift leverage toward buyers. Finally, mortgage rate movement around the mid-6% range will play a key role in determining affordability and transaction momentum heading into the next selling season.
– Grant Van Dyke
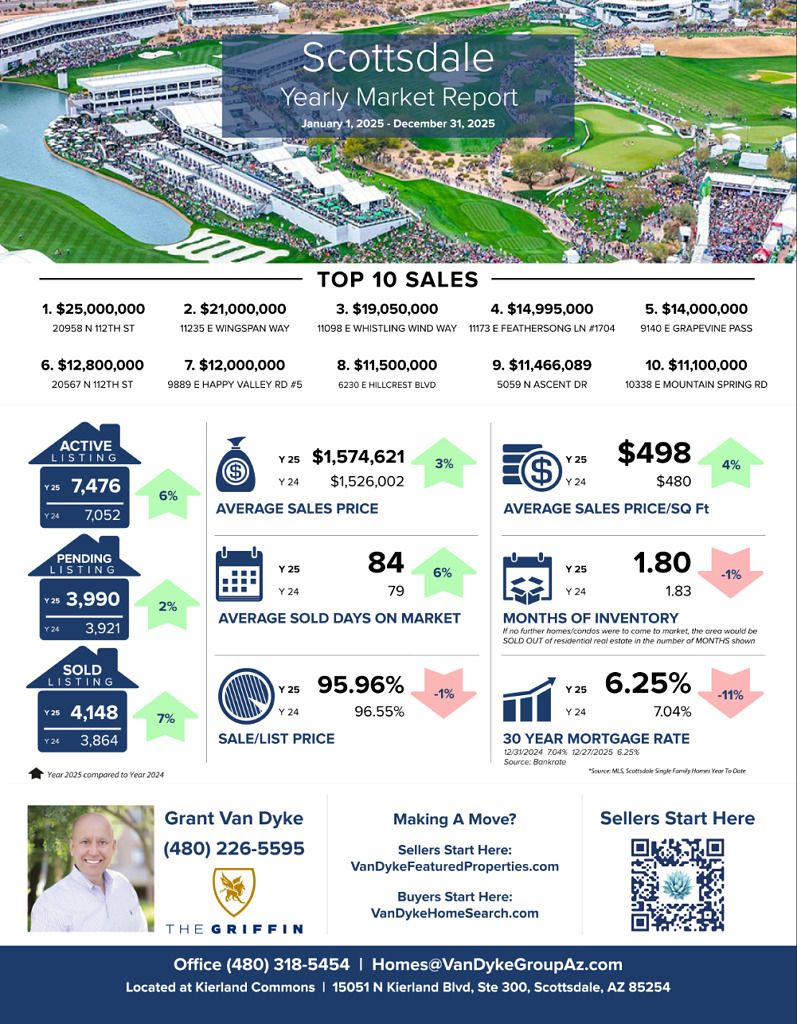
Scottsdale
Average Sales Price: 2024 > $1,526,002 vs 2025 > $1,574,621 = 3% increase
Average Days On Market: 2024 > 79 vs 2025 > 84 = 6% increase
Average Sale Price Per Square Foot: 2024 > $480 vs 2025 > $498 = 4% increase
Sale to List Price Ratio: 2024 > 96.55% vs 2025 > 95.96% = 1% decrease
Number of Sold Listings: 2024 > 3864 vs 2025 > 4148 = 7% increase
Months Supply of Inventory: 2024 > 1.83 vs 2025 > 1.8 = 1% decrease
Mortgage Rate: 2024 > 7.04% vs 2025 > 6.25% = 11% decrease
Top 10 Sales
$25,000000, 20958 N 112th St
$21,000,000 11235 E Wingspan Way
$19,050,000 11098 E Whistling Wind Way
$14,995,000 11173 E Feathersong Ln #1704
$14,000,000 9140 E Grapevine Pass
$12,800,000 20567 N 112th St
$12,000,000 9889 E Happy Valley Rd #5
$11,500,000 6230 E Hillcrest Blvd
$11,466,089 5059 N Ascent Dr
$11,100,000 10338 E Mountain Spring Rd
GRAB OUR FREE COURSES
➡️ 6 Steps To Home Buyer Success – http://vandykebuyerplan.com
➡️ 7 Steps To Home Seller Plan – http://vandykesellerplan.com
➡️ 8 Steps To Agent Success – http://vandykeagentplan.com


