
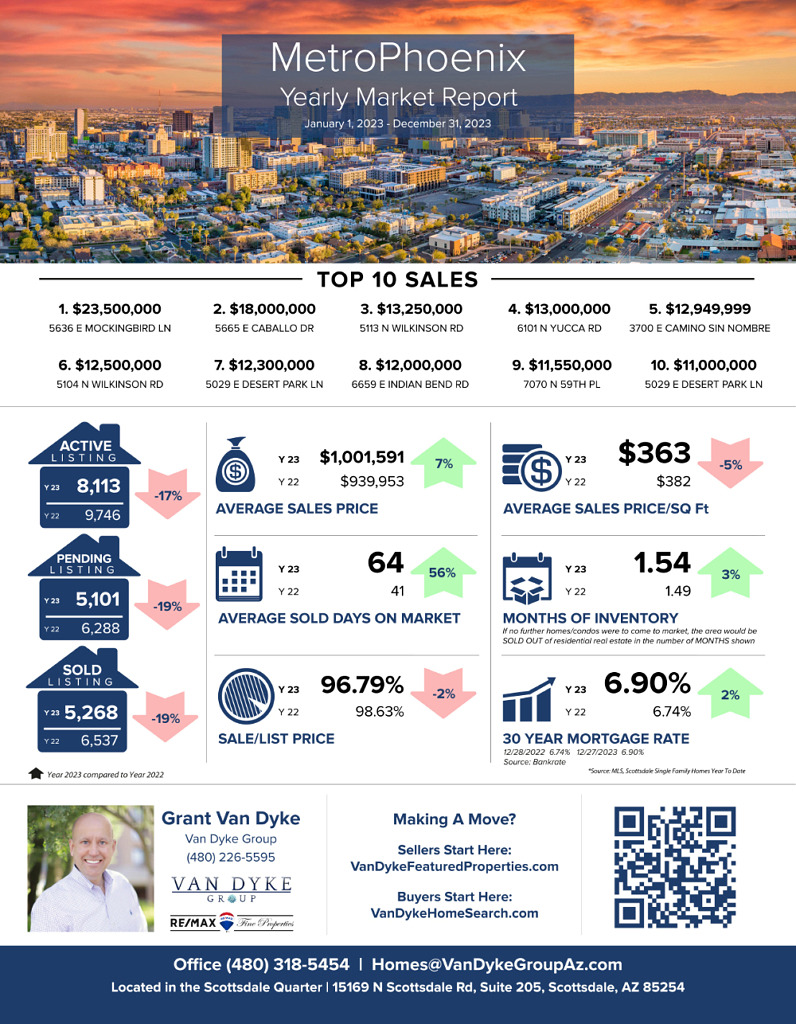
A 19% decrease in SOLD properties reflects reduced demand and market activity. Despite this decline, the Average Sales Price Increased by a strong 7%, while the Average Price Per square foot declined, indicating consistent pricing dynamics. The rise in available homes for sale suggests a shift toward a more balanced market. However, with interest rates dropping below 7%, as the MetroPhoenix home selling season gains momentum, we anticipate a market slightly favoring sellers. Effective marketing, exposure, and agent representation become crucial for sellers and buyers in such markets.
– Grant Van Dyke
Metro Phoenix
Average Sales Price: 2022 > $939,953 vs 2023 > $1,001,591 = 7% increase
Average Days On Market: 2022 > 41 vs 2023 > 64 = 56% increase
Average Sale Price Per Square Foot: 2022 > $382 vs 2023 > $363 = 5% decrease
Sale to List Price Ratio: 2022 > 98.63% vs 2023 > 96.79% = 2% decrease
Number of Sold Listings: 2022 > 6,537 vs 2023 > 5,268 = 19% decrease
Months Supply of Inventory: 2022 > 1.49 vs 2023 > 1.54 = 3% increase
Mortgage Rate: 2022 > 6.74% vs 2023 > 6.90% = 2% increase
Top 10 Sales
$23,500,000 5636 E Mockingbird Ln, Paradise Valley
$18,000,000 5665 E Caballo Dr, Paradise Valley
$13,250,000 5113 N Wilkinson Rd, Paradise Valley
$13,000,000 6101 N Yucca Rd, Paradise Valley
$12,949,999 3700 E Camino Sin Nombre, Paradise Valley
$12,500,000 5104 N Wilkinson Rd, Paradise Valley
$12,300,000 5029 E Desert Park Ln, Paradise Valley
$12,000,000 6659 E Indian Bend Rd, Paradise Valley
$11,550,000 7070 N 59th Pl, Paradise Valley
$11,000,000 5029 E Desert Park Ln, Paradise Valley


