
A growing number of sellers are becoming more flexible with their initial asking prices. Recent reports indicate that in September, approximately 9.2% of home listings experienced a reduction in their listed prices. This trend is increasingly creating opportunities for prospective buyers, provided they can overlook the impact of interest rates. The market boasts a higher volume of active listings and a more significant number of motivated sellers since last December. This fall, the elevated percentage of price reductions could be attributed to sellers setting overly ambitious initial listing prices, buyers exercising caution due to rising interest rates, or a combination of these factors.
– Grant Van Dyke
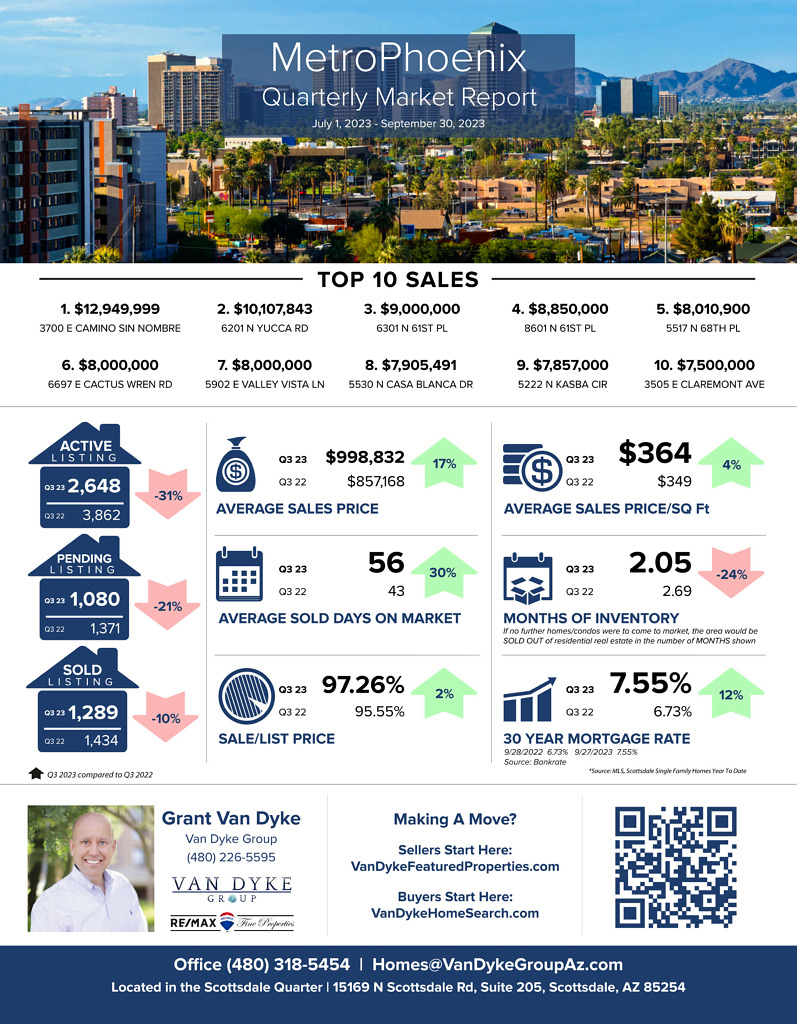
Metro Phoenix | 3rd Quarter 2023
Average Sales Price: Q3 2022 > $857,168 vs Q3 2023 > $998,832 = 17% increase
Average Days On Market: Q3 2022 > 43 vs Q3 2023 > 56 = 30% increase
Average Sale Price Per Square Foot: Q3 2022 > $349 vs Q3 2023 > $364 = 4% increase
Sale to List Price Ratio: Q3 2022 > 95.55% vs Q3 2023 > 97.26% = 2% increase
Number of Sold Listings: Q3 2022 > 1434 vs Q3 2023 > 1289 = 10% decrease
Months Supply of Inventory: Q3 2022 > 2.69 vs Q3 2023 > 2.05 = 24% decrease
Mortgage Rate: Q3 2022 > 6.73% vs Q3 2023 > 7.55% = 12% increase
Top 10 Sales
$12,949,999 3700 E Camino Sin Nombre, Paradise Valley
$10,107,843 6201 N Yucca Rd, Paradise Valley
$9,000,000 6301 N 61st Pl, Paradise Valley
$8,850,000 8601 N 61st Pl, Paradise Valley
$8,010,900 5517 N 68th Pl, Paradise Valley
$8,000,000 6697 E Cactus Wren Rd, Paradise Valley
$8,000,000 5902 E Valley Vista Ln, Paradise Valley
$7,905,491 5530 N Casa Blanca Dr, Paradise Valley
$7,857,000 5222 N Kasba Cir, Paradise Valley
$7,500,000 3505 E Claremont Ave, Paradise Valley


