 See photos and updates from listings directly in your feed
 Share your favorite listings with friends and family
 Save your search and get new listings directly in your mailbox before everybody else
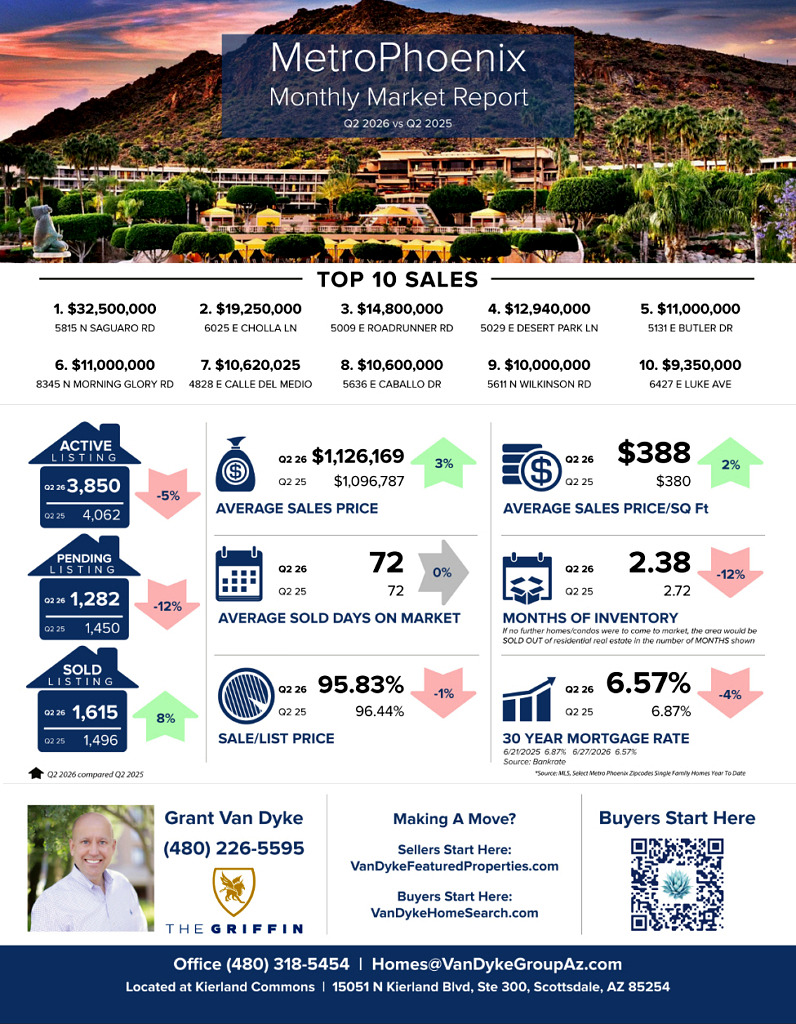
The biggest trend to watch is whether inventory remains tight enough to continue supporting home prices as buyer activity remains subdued. Although mortgage rates have eased slightly, financing costs remain high enough to limit affordability and are not yet generating a meaningful increase in sales. If transaction volume continues to lag, sellers may need to become increasingly competitive on pricing and concessions to attract today’s value-conscious buyers.
– Grant Van Dyke
Metro Phoenix
Average Sales Price: Q2 2025 > $1,096,787 vs Q2 2026 > $1,126,169 = 3% increase
Average Days On Market: Q2 2025 > 72 vs Q2 2026 > 72 = 0% Change
Average Sale Price Per Square Foot: Q2 2025 > $380 vs Q2 2026 > $388 = 2% increase
Sale to List Price Ratio: Q2 2025 > 96.44% vs Q2 2026 > 95.83% = 1% decrease
Number of Sold Listings: Q2 2025 > 1,496 vs Q2 2026 > 1,615 = 8% increase
Months Supply of Inventory: Q2 2025 > 2.72 vs Q2 2026 > 2.38 = 12% decrease
Mortgage Rate: Q2 2025 > 6.87% vs Q2 2026 > 6.57% = 4% decrease
Top 10 Sales
$32,500,000 5815 N Saguaro Rd, Paradise Valley
$19,250,000 6025 E Cholla Ln, Paradise Valley
$14,800,000 5009 E Roadrunner Rd, Paradise Valley
$12,940,000 5029 E Desert Park Ln, Paradise Valley
$11,000,000 5131 E Butler Dr, Paradise Valley
$11,000,000 8345 N Morning Glory Rd, Paradise Valley
$10,620,025 4828 E Calle Del Medio, Phoenix
$10,600,000 5636 E Caballo Dr, Paradise Valley
$10,000,000 5611 N Wilkinson Rd, Paradise Valley
$9,350,000 6427 E Luke Ave, Paradise Valley
GRAB OUR FREE COURSES
➡️ 6 Steps To Home Buyer Success – http://vandykebuyerplan.com
➡️ 7 Steps To Home Seller Plan – http://vandykesellerplan.com
➡️ 8 Steps To Agent Success – http://vandykeagentplan.com