In the coming months, it’s important to watch for continued inventory growth, which is giving buyers more choices and shifting negotiating power away from sellers. Although average sale prices are holding steady, the decline in price per square foot and longer time on market Hint at softening demand. If mortgage rates continue to ease, even slightly, it could reawaken sidelined buyers and create new momentum. Overall, conditions are tilting towards a more balanced, even buyer-favorable market.
– Grant Van Dyke
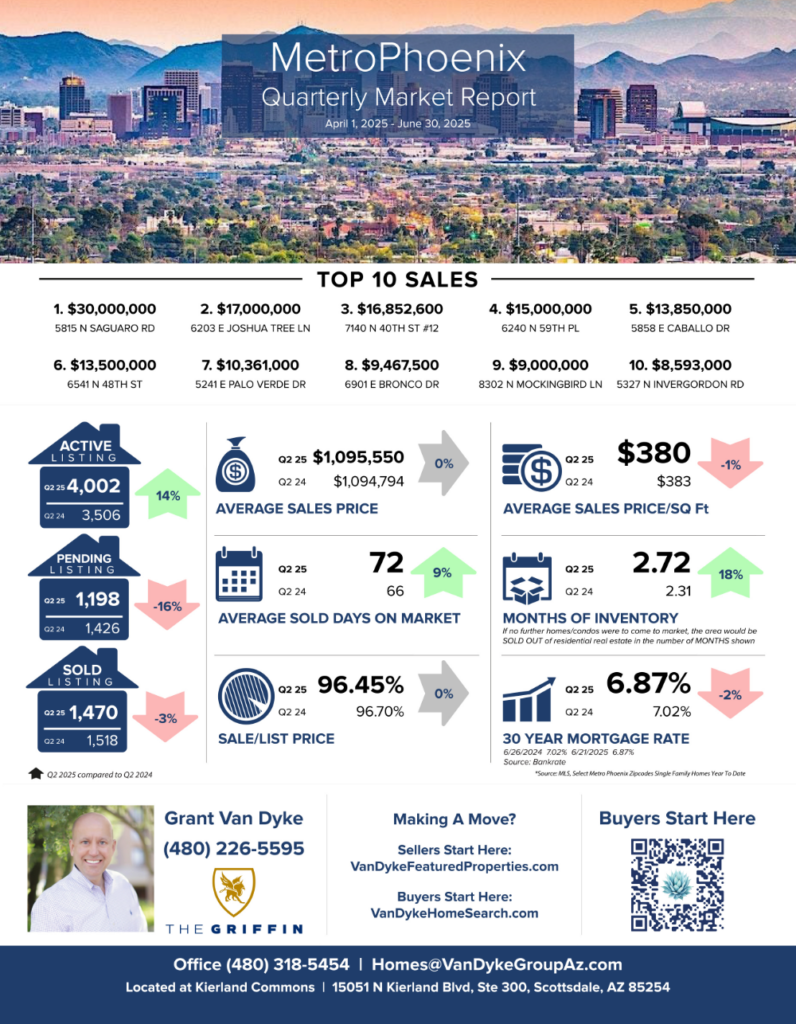
Metro Phoenix
Average Sales Price: Q2 2025 > $1,095,550 vs Q2 2024 > $1,094,794 = 0% change
Average Days On Market: Q2 2025 > 72 vs Q2 2024 > 66 = 9% increase
Average Sale Price Per Square Foot: Q2 2025 > $380 vs Q2 2024 > $383 = 1% decrease
Sale to List Price Ratio: Q2 2025 > 96.45% vs Q2 2024 > 96.70% = 0% change
Number of Sold Listings: Q2 2025 > 1470 vs Q2 2024 > 1518 = 3% decrease
Months Supply of Inventory: Q2 2025 > 2.72 vs Q2 2024 > 2.31 = 18% increase
Mortgage Rate: Q2 2025 > 6.87% vs Q2 2024 > 7.02% = 2% decrease
Top 10 Sales
$30,000,000 5815 N Saguaro Rd, Paradise Valley
$17,000,000 6203 E Joshua Tree Ln, Paradise Valley
$16,852,600 7140 N 40th St #12, Paradise Valley
$15,000,000 6240 N 59th Pl, Paradise Valley
$13,850,000 5858 E Caballo Dr, Paradise Valley
$13,500,000 6541 N 48th St, Paradise Valley
$10,361,000 5241 E Palo Verde Dr, Paradise Valley
$9,467,500 6901 E Bronco Dr, Paradise Valley
$9,000,000 8302 N Mockingbird Ln, Paradise Valley
$8,593,000 5327 N Invergordon Rd, Paradise Valley
GRAB OUR FREE COURSES
➡️ 6 Steps To Home Buyer Success – http://vandykebuyerplan.com
➡️ 7 Steps To Home Seller Plan – http://vandykesellerplan.com
➡️ 8 Steps To Agent Success – http://vandykeagentplan.com


