Direct Access To All Multiple Listings Like Realtors®

(Prices and inventory current as of Nov 30, 1999)

See Pictures and updates (icon)See photos and updates from listings directly in your feed

Share with you friends (icon)Share your favorite listings with friends and family

Save your search (icon)Save your search and get new listings directly in your mailbox before everybody else

Direct Access To All Multiple
Listings Like Realtors®

(Prices and inventory current as of Nov 30, 1999)

See Pictures and updates (icon)See photos and updates from listings directly in your feed

Share with you friends (icon)Share your favorite listings with friends and family

Save your search (icon)Save your search and get new listings directly in your mailbox before everybody else

Sign Up

it's quick and easy

We'll never post to social networks

or

  • This field is for validation purposes and should be left unchanged.

Already an account? Log in here

Log in

Please check username or password!

No account yet? Register here

Password forgotten? Reset your password

Reset your password

The email address does not seems to be correct!

Please check your email to reset your password

No account yet? Register here

Real Estate Market Update | Metro Phoenix | Quarter 1 2025 vs Quarter 1 2024

Real Estate Market Update | Metro Phoenix | Quarter 1 2025 vs Quarter 1 2024

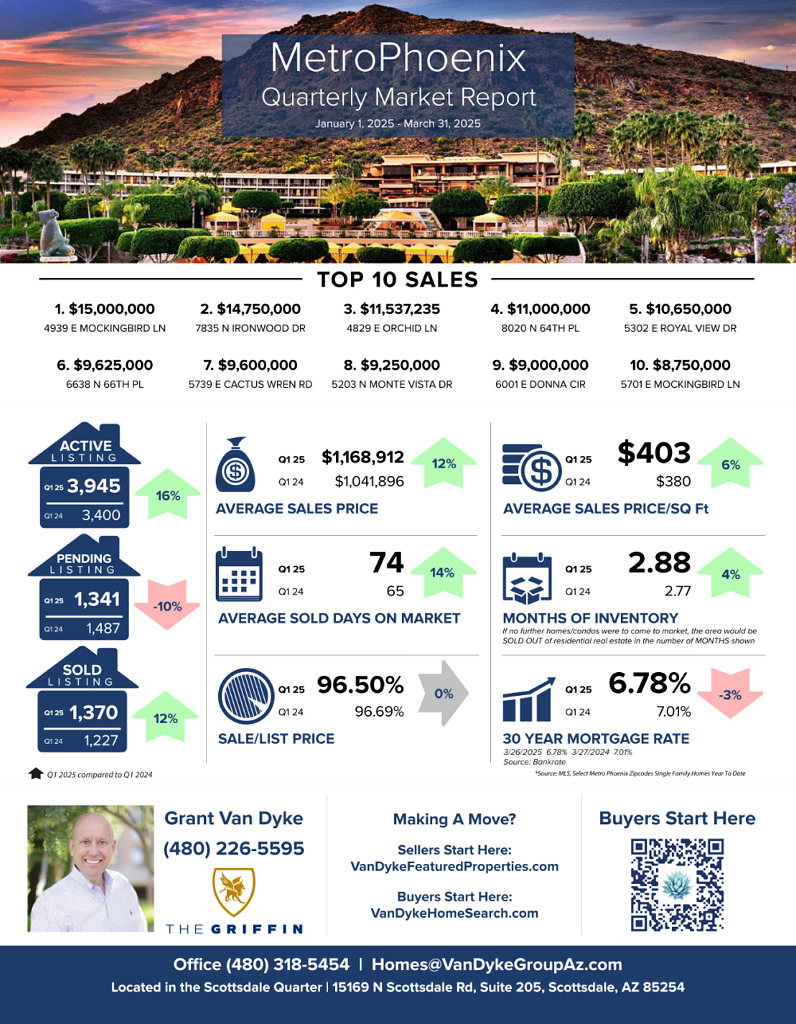
Metro Phoenix home values rose 12% in Quarter 1 of 2025, signaling strong appreciation and motivating buyers to act before prices climb higher. Inventory also grew by 4%, giving buyers more choices while encouraging sellers to price strategically in a more competitive market. With mortgage rates down to 6.78%, improved affordability is fueling demand and increasing buyer confidence.

– Grant Van Dyke

Metro Phoenix

Average Sales Price: Q1 2024 > $1,041,896 vs Q1 2025 > $1,168,912 = 12% increase

Average Days On Market: Q1 2024 > 65 vs Q1 2025 > 74 = 14% increase

Average Sale Price Per Square Foot: Q1 2024 > $380 vs Q1 2025 > $403 = 6% increase

Sale to List Price Ratio: Q1 2024 > 96.69% vs Q1 2025 > 96.50% = <1% 

Number of Sold Listings: Q1 2024 > 1227 vs Q1 2025 > 1370 = 12% increase

Months Supply of Inventory: Q1 2024 > 2.77 vs Q1 2025 > 2.88 = 4% increase

Mortgage Rate: Q1 2024 > 7.01% vs Q1 2025 > 6.78% = 3% decrease

Top 10 Sales

$15,000,000 4939 E Mockingbird Ln, Paradise Valley 

$14,750,000 7835 N Ironwood Dr, Paradise Valley 

$11,537,235 4829 E Orchid Ln, Paradise Valley 

$11,000,000 8020 N 64th Pl, Paradise Valley 

$10,650,000 5302 E Royal View Dr, Phoenix 

$9,625,000 6638 N 66th Pl, Paradise Valley 

$9,600,000 5739 E Cactus Wren Rd, Paradise Valley 

$9,250,000 5203 N Monte Vista Dr, Paradise Valley 

$9,000,000 6001 E Donna Cir, Paradise Valley 

$8,750,000 5701 E Mockingbird Ln, Paradise Valley 

Recent Posts

Categories