Overall, the Metro Phoenix real estate market saw some mixed results for March 2023, with a decrease in the number of sold listings and the average sales price. While the increase in inventory may provide more opportunities for buyers, mortgage rates remain in the mid 6’s. In the words of Dave Ramsey, buy the home today and refinance later when rates come down.
– Grant Van Dyke
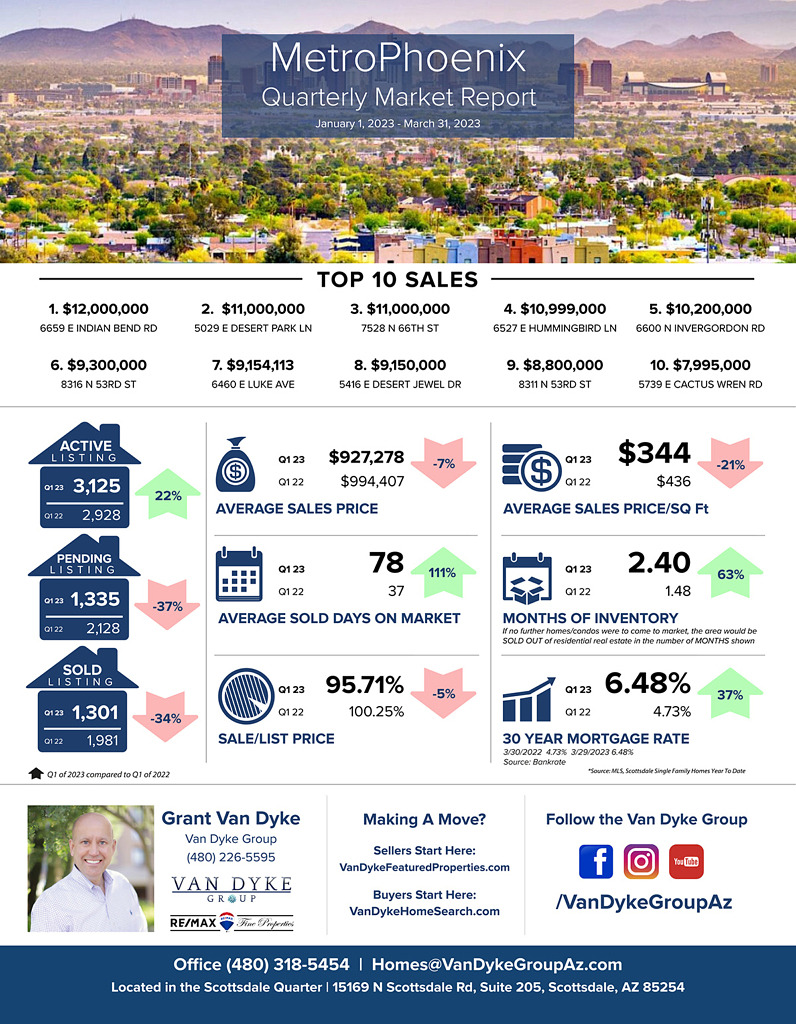
Metro Phoenix
Average Sales Price: Q1 2022 > $994,407 vs Q1 2023 > $927,278 = 7% decrease
Average Days On Market: Q1 2022 > 37 vs Q1 2023 > 78 = 111% increase
Average Sale Price Per Square Foot: Q1 2022 > $436 vs Q1 2023 > $344 = 21% decrease
Sale to List Price Ratio: Q1 2022 > 100.25% vs Q1 2023 > 95.71% = 5% decrease
Number of Sold Listings: Q1 2022 > 1981 vs Q1 2023 > 1301 = 34% decrease
Months Supply of Inventory: Q1 2022 > 1.48 vs Q1 2023 > 2.4 = 63% increase
Mortgage Rate: Q1 2022 > 4.73% vs Q1 2023 > 6.48% = 37% increase
Top 10 Sales
$12,000,000 6659 E Indian Bend Rd, Paradise Valley
$11,000,000 5029 E Desert Park Ln, Paradise Valley
$11,000,000 7528 N 66th St, Paradise Valley
$10,999,000 6527 E Hummingbird Ln, Paradise Valley
$10,200,000 6600 N Invergordon Rd, Paradise Valley
$9,300,000 8316 N 53rd St, Paradise Valley
$9,154,113 6460 E Luke Ave, Paradise Valley
$9,150,000 5416 E Desert Jewel Dr, Paradise Valley
$8,800,000 8311 N 53rd St, Paradise Valley
$7,995,000 5739 E Cactus Wren Rd, Paradise Valley


