
The Metro-Phoenix housing market for July 2023 indicates a decline in sold listings and average sales prices for the 2nd consecutive month, with an increase in inventory. However, U.S. property values are up in all regions except for the West and Mountain, which serve as lead indicators for market trends. It remains to be seen whether we are coming out of a slow summer season or witnessing the future of a market to come. If you plan to sell your property within the next 6 months, now may be an opportune time to do so.
– Grant Van Dyke
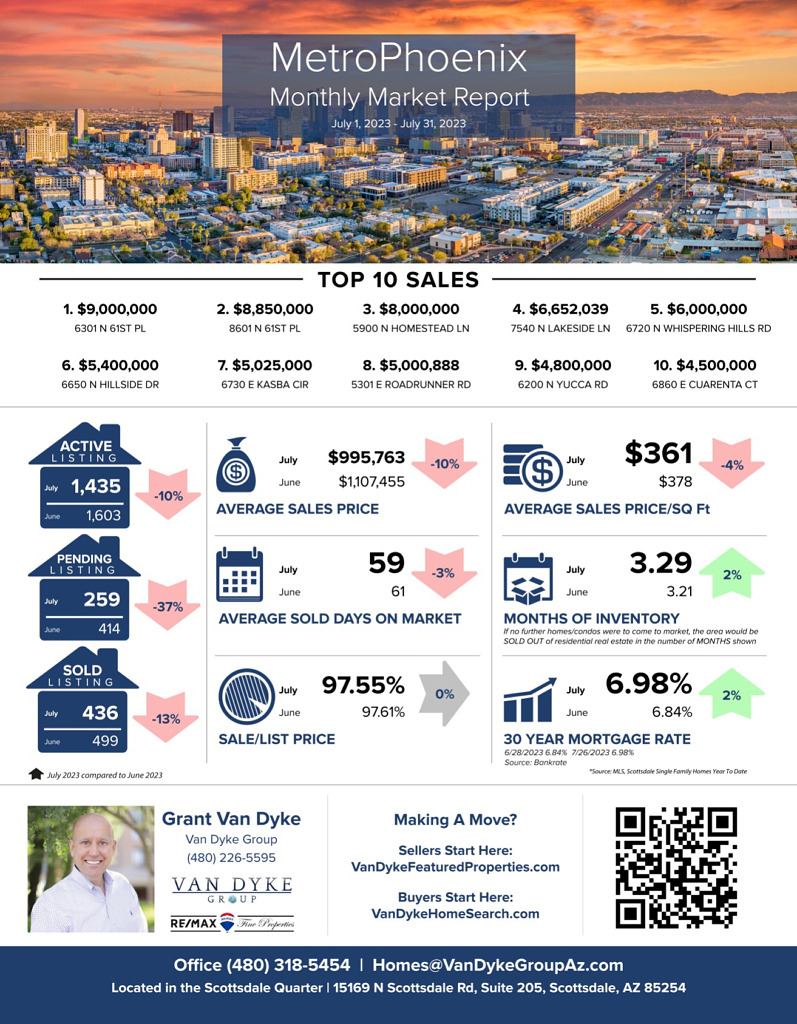
Metro Phoenix
Average Sales Price: June 2023 > $1,107,455 vs July 2023 > $995,763 = 10% decrease
Average Days On Market: June 2023 > 61 vs July 2023 > 59 = 3% decrease
Average Sale Price Per Square Foot: June 2023 > $378 vs July 2023 > $361 = 4% decrease
Sale to List Price Ratio: June 2023 > 97.61% vs July 2023 > 97.55% = 0% change
Number of Sold Listings: June 2023 > 499 vs July 2023 > 436 = 13% decrease
Months Supply of Inventory: June 2023 > 3.21 vs July 2023 > 3.29 = 2% increase
Mortgage Rate: June 2023 > 6.84% vs July 2023 > 6.98% = 2% increase
Top 10 Sales
$9,000,000 6301 N 61st Place, Paradise Valley
$8,850,000 8601 N 61st Place, Paradise Valley
$8,000,000 5900 N Homestead Ln, Paradise Valley
$6,652,039 7540 N Lakeside Ln, Paradise Valley
$6,000,000 6720 N Whispering Hills Rd, Paradise Valley
$5,400,000 6650 N Hillside Dr, Paradise Valley
$5,025,000 6730 E Kasba Circle, Paradise Valley
$5,000,888 5301 E Roadrunner Rd, Paradise Valley
$4,800,000 6200 N Yucca Rd, Paradise Valley
$4,500,000 6860 E Cuarenta Ct, Paradise Valley


