In the coming months, it’s important to watch whether Metro Phoenix inventory continues to build, as sustained supply above six months would keep negotiating leverage tilted toward buyers. It will also be critical to track whether pricing holds or softens as more mid-range homes close, since recent price gains were influenced by higher-end transactions rather than broad market acceleration. Finally, mortgage-rate movement near the low-6% range will matter most in how it affects buyer confidence, but inventory levels and pricing discipline will remain the primary drivers of market outcomes.
– Grant Van Dyke
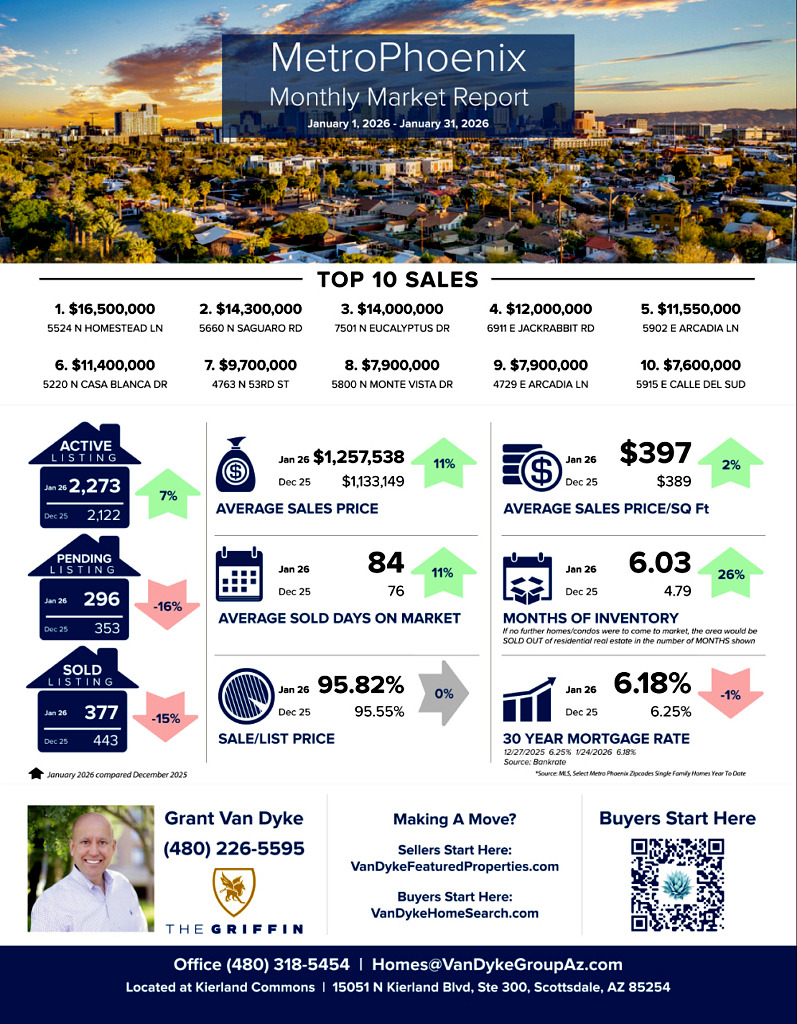
Metro Phoenix
Average Sales Price: December 2025 > $1,133,149 vs January 2026 > $1,257,538 = 11% increase
Average Days On Market: December 2025 > 76 vs January 2026 > 84 = 11% increase
Average Sale Price Per Square Foot: December 2025 > $389 vs January 2026 > $397 = 2% increase
Sale to List Price Ratio: December 2025 > 95.55% vs January 2026 > 95.82% = 0% change
Number of Sold Listings: December 2025 > 443 vs January 2026 > 377 = 15% decrease
Months Supply of Inventory: December 2025 > 4.79 vs January 2026 > 6.03 = 26% increase
Mortgage Rate: December 2025 > 6.25% vs January 2026 > 6.18% = 1% decrease
Top 10 Sales
$16,500,000 5524 N Homestead Ln, Paradise Valley
$14,300,000 5660 N Saguaro Rd, Paradise Valley
$14,000,000 7501 N Eucalyptus Dr, Paradise Valley
$12,000,000 6911 E Jackrabbit Rd, Paradise Valley
$11,550,000 5902 E Arcadia Ln, Phoenix
$11,400,000 5220 N Casa Blanca Dr, Paradise Valley
$9,700,000 4763 N 53rd Street, Phoenix
$7,900,000 5800 N Monte Vista Dr, Paradise Valley
$7,900,000 4729 E Arcadia Ln, Phoenix
$7,600,000 5915 E Calle Del Sud, Phoenix
GRAB OUR FREE COURSES
➡️ 6 Steps To Home Buyer Success – http://vandykebuyerplan.com
➡️ 7 Steps To Home Seller Plan – http://vandykesellerplan.com
➡️ 8 Steps To Agent Success – http://vandykeagentplan.com


