
In the coming months, it’s important to watch whether buyer demand remains steady as mortgage rates hover near the mid-6% range, since even small rate changes can quickly impact affordability and activity across Metro Phoenix. It will also be critical to monitor pricing discipline, as homes that align with market reality are selling while overpriced listings sit longer, reinforcing a more selective, data-driven buyer mindset. Finally, keep an eye on inventory levels, because even modest increases in supply could continue shifting leverage toward buyers and further separate well-prepared sellers from the rest of the market.
– Grant Van Dyke
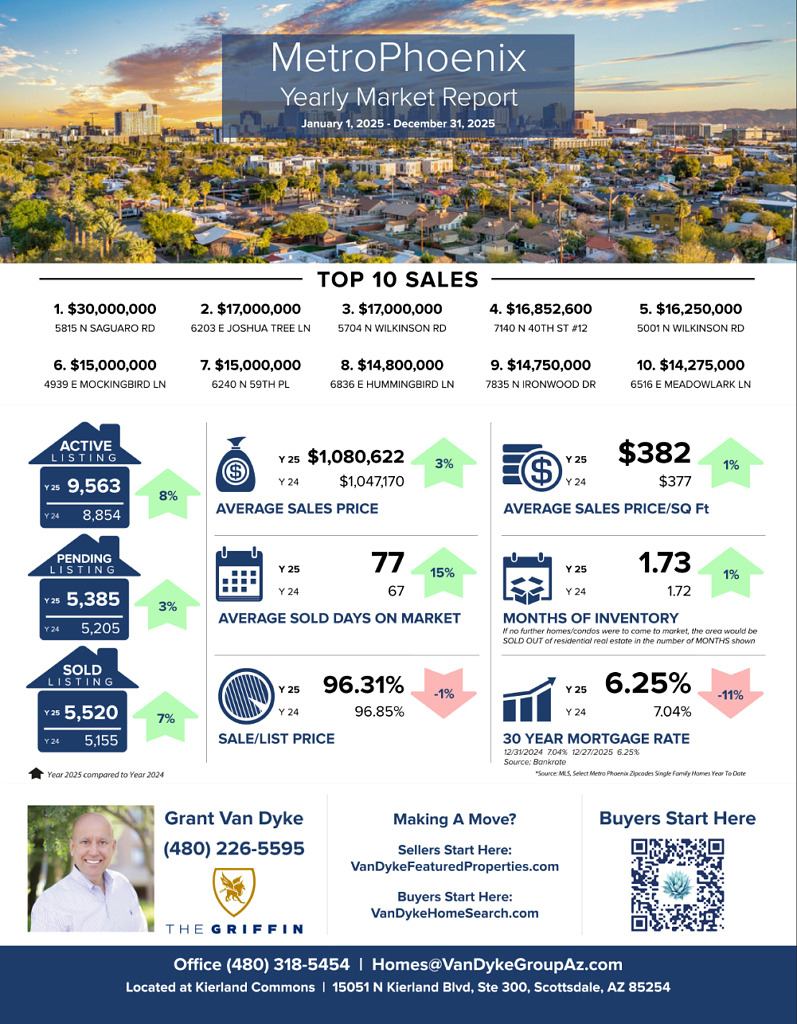
Metro Phoenix
Average Sales Price: 2024 > $1,047,170 vs 2025 > $1,080,622 = 3% increase
Average Days On Market: 2024 > 67 vs 2025 > 77 = 15% increase
Average Sale Price Per Square Foot: 2024 > $377 vs 2025 > $382 = 1% increase
Sale to List Price Ratio: 2024 > 96.85% vs 2025 > 96.31% = 1% decrease
Number of Sold Listings: 2024 > 5155 vs 2025 > 5520 = 7% increase
Months Supply of Inventory: 2024 > 1.72 vs 2025 > 1.73 = 1% increase
Mortgage Rate: 2024 > 7.04% vs 2025 > 6.25% = 11% decrease
Top 10 Sales
$30,000,000 5815 N Saguaro Rd, Paradise Valley
$17,000,000 6203 E Joshua Tree Ln, Paradise Valley
$17,000,000 5704 N Wilkinson Rd, Paradise Valley
$16,852,600 7140 N 40th St #12, Paradise Valley
$16,250,000 5001 N Wilkinson Rd, Paradise Valley
$15,000,000 4939 E Mockingbird Ln, Paradise Valley
$15,000,000 6240 N 59th Pl, Paradise Valley
$14,800,000 6836 E Hummingbird Ln, Paradise Valley
$14,750,000 7835 N Ironwood Dr, Paradise Valley
$14,275,000 6516 E Meadowlark Ln, Paradise Valley
GRAB OUR FREE COURSES
➡️ 6 Steps To Home Buyer Success – http://vandykebuyerplan.com
➡️ 7 Steps To Home Seller Plan – http://vandykesellerplan.com
➡️ 8 Steps To Agent Success – http://vandykeagentplan.com


