 See photos and updates from listings directly in your feed
 Share your favorite listings with friends and family
 Save your search and get new listings directly in your mailbox before everybody else
In the coming months, it’s important to watch whether financing conditions improve enough to bring more buyers into the market. Until sales activity strengthens meaningfully, home prices are likely to remain under pressure, with sellers facing increased competition for a limited pool of qualified buyers. The direction of mortgage rates and buyer demand will ultimately determine whether pricing stabilizes or softens further through the second half of the year.
– Grant Van Dyke
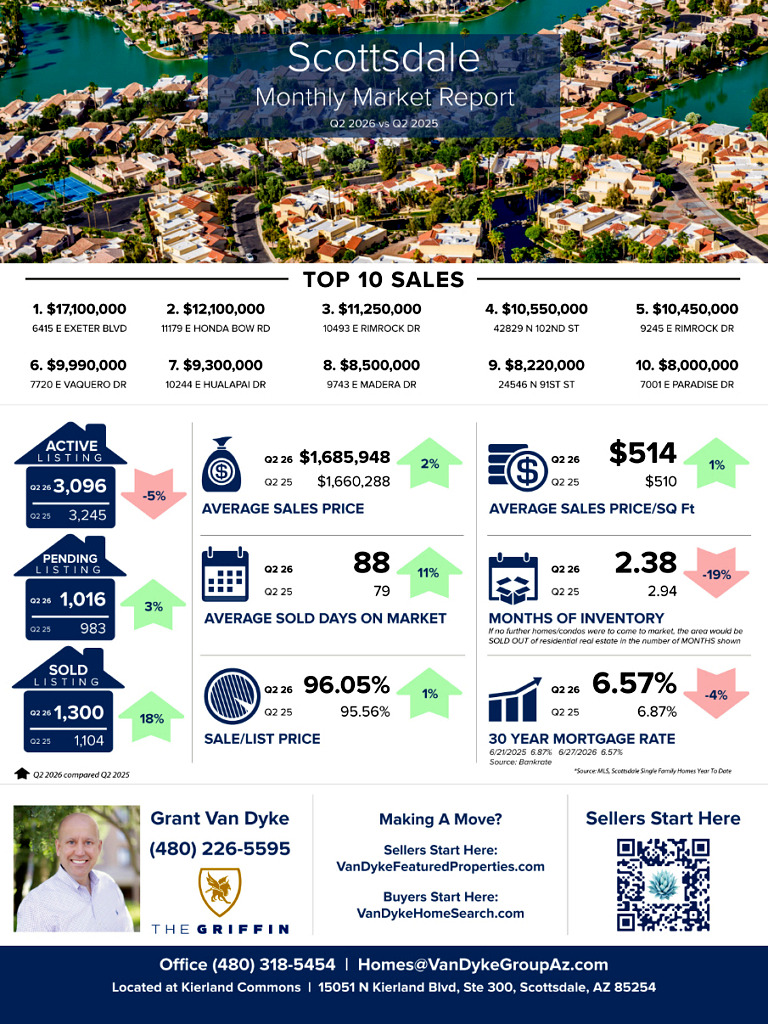
Scottsdale
Average Sales Price: Q2 2025 > $1,660,288 vs Q2 2026 > $1,685,948 = 2% increase
Average Days On Market: Q2 2025 > 79 vs Q2 2026 > 88 = 11% increase
Average Sale Price Per Square Foot: Q2 2025 > $510 vs Q2 2026 > $514 =1% increase
Sale to List Price Ratio: Q2 2025 > 95.56% vs Q2 2026 > 96.05% = 1% increase
Number of Sold Listings: Q2 2025 > 1104 vs Q2 2026 > 1300 = 18% increase
Months Supply of Inventory: Q2 2025 > 2.94 vs Q2 2026 > 2.38 = 19% decrease
Mortgage Rate: Q2 2025 > 6.87% vs Q2 2026 > 6.57% = 4% decrease
Top 10 Sales
$17,100,000 6415 E Exeter Blvd
$12,100,000 11179 E Honda Bow Rd
$11,250,000 10493 E Rimrock Dr
$10,550,000 42829 N 102nd St
$10,450,000 9245 E Rimrock Dr
$9,990,000 7720 E Vaquero Dr
$9,300,000 10244 E Hualapai Dr
$8,500,000 9743 E Madera Dr
$8,220,000 24546 N 91st St
$8,000,000 7001 E Paradise Dr
GRAB OUR FREE COURSES
➡️ 6 Steps To Home Buyer Success – http://vandykebuyerplan.com
➡️ 7 Steps To Home Seller Plan – http://vandykesellerplan.com
➡️ 8 Steps To Agent Success – http://vandykeagentplan.com