Direct Access To All Multiple Listings Like Realtors®

(Prices and inventory current as of Nov 30, 1999)

See Pictures and updates (icon)See photos and updates from listings directly in your feed

Share with you friends (icon)Share your favorite listings with friends and family

Save your search (icon)Save your search and get new listings directly in your mailbox before everybody else

Direct Access To All Multiple
Listings Like Realtors®

(Prices and inventory current as of Nov 30, 1999)

See Pictures and updates (icon)See photos and updates from listings directly in your feed

Share with you friends (icon)Share your favorite listings with friends and family

Save your search (icon)Save your search and get new listings directly in your mailbox before everybody else

Sign Up

it's quick and easy

We'll never post to social networks

or

  • This field is for validation purposes and should be left unchanged.

Already an account? Log in here

Log in

Please check username or password!

No account yet? Register here

Password forgotten? Reset your password

Reset your password

The email address does not seems to be correct!

Please check your email to reset your password

No account yet? Register here

Real Estate Market Update | Scottsdale | Quarter 1 2025 vs Quarter 1 2024

Real Estate Market Update | Scottsdale | Quarter 1 2025 vs Quarter 1 2024

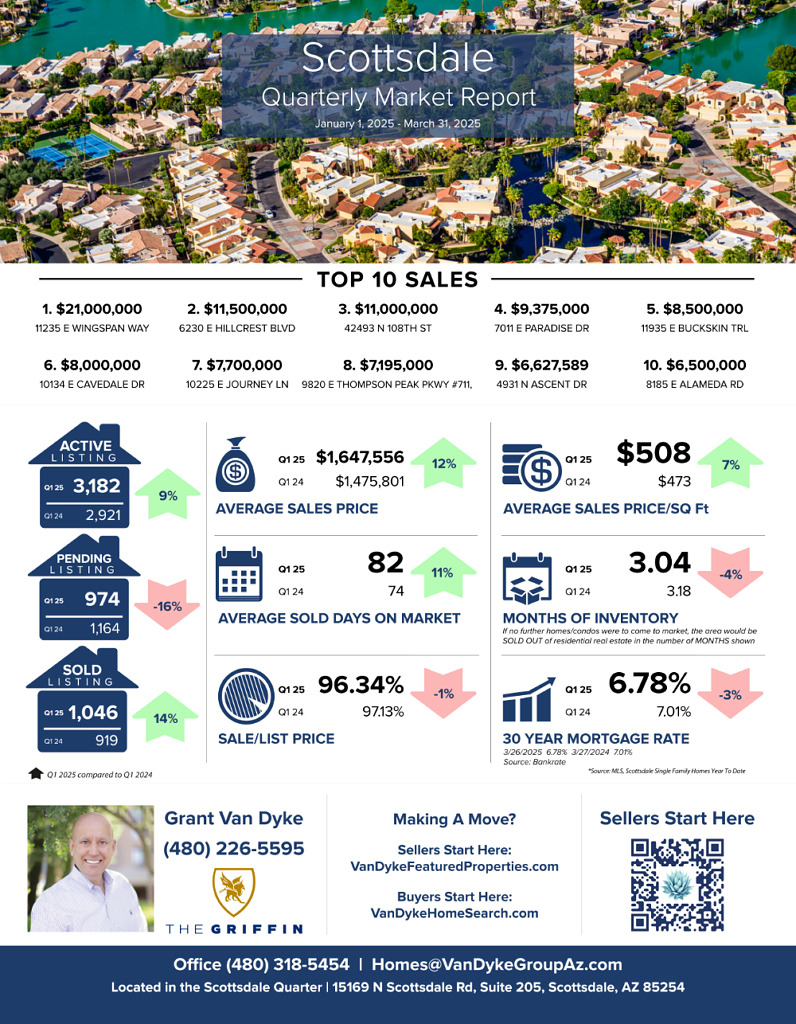
Scottsdale’s real estate market surged in Quarter 1 of 2025, with home values and sales up 12%, while mortgage rates dipped slightly to 6.78%, creating a window of opportunity for buyers. Inventory also rose 4%, offering more choices and slightly less competition in a still-active market. Sellers continue to benefit from strong demand, but strategic pricing and standout presentation are more important than ever.

– Grant Van Dyke

Scottsdale

Average Sales Price: Q1 2024 > $1475801 vs Q1 2025 > $1647556 = 12% increase

Average Days On Market: Q1 2024 > 74 vs Q1 2025 > 82 = 11% increase

Average Sale Price Per Square Foot: Q1 2024 > $473 vs Q1 2025 > $508 = 7% increase

Sale to List Price Ratio: Q1 2024 > 97.13% vs Q1 2025 > 96.34% = 1% decrease

Number of Sold Listings: Q1 2024 > 919 vs Q1 2025 > 1046 = 14% increase

Months Supply of Inventory: Q1 2024 > 3.18 vs Q1 2025 > 3.04 = 4% decrease

Mortgage Rate: Q1 2024 > 7.01% vs Q1 2025 > 6.78% = 3% decrease

Top 10 Sales

$21,000,000 11235 E Wingspan Way

$11,500,000 6230 E Hillcrest Boulevard

$11,000,000 42493 N 108th Street

$9,375,000 7011 E Paradise Drive

$8,500,000 11935 E Buckskin Trail

$8,000,000 10134 E Cavedale Drive

$7,700,000 10225 E Journey Lane

$7,195,000 9820 E Thompson Peak Pkwy #711

$6,627,589 4931 N Ascent Drive

$6,500,000 8185 E Alameda Road

Recent Posts

Categories