In the coming months, it’s important to watch for how long elevated inventory levels persist, especially in the $1M+ range, where buyer activity has slowed significantly. If mortgage rates begin to ease, pent-up demand could return quickly, tightening supply and firming up prices. For now, buyers have a strategic window of opportunity, but that balance could shift if confidence or affordability improves.
– Grant Van Dyke
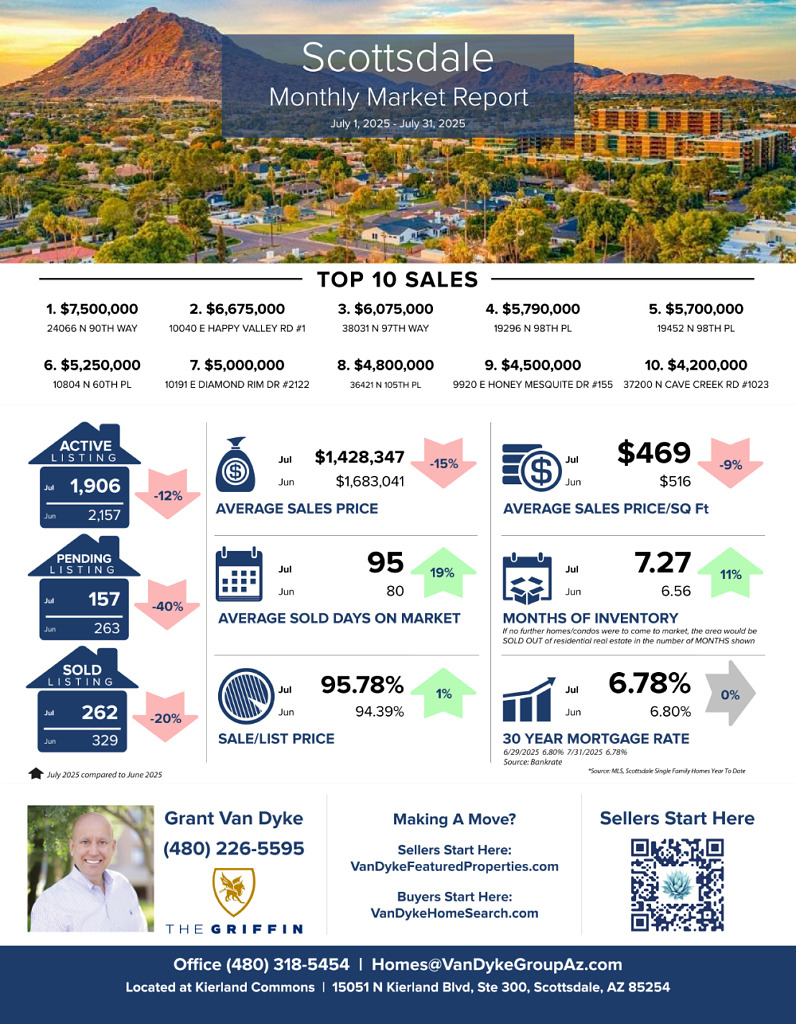
Scottsdale
Average Sales Price: June 2025 – $1683041 vs July 2025 – $1428347 = 15% decrease
Average Days On Market: June 2025 – 80 vs July 2025 – 95 = 19% increase
Average Sale Price Per Square Foot: June 2025 – $516 vs July 2025 – $469 = 9% decrease
Sale to List Price Ratio: June 2025 – 94.39% vs July 2025 – 95.78% = 1% increase
Number of Sold Listings: June 2025 – 329 vs July 2025 – 262 = 20% decrease
Months Supply of Inventory: June 2025 – 6.56 vs July 2025 – 7.27 = 11% increase
Mortgage Rate: June 2025 – 6.80% vs July 2025 – 6.78% = 0% No Change
Top 10 Sales
$7,500,000 24066 N 90th Way
$6,675,000 10040 E Happy Valley Road, #1
$6,075,000 38031 N 97th Way
$5,790,000 19296 N 98th Place
$5,700,000 19452 N 98th Place
$5,250,000 10804 N 60th Place
$5,000,000 10191 E Diamond Rim Drive, #2122
$4,800,000 36421 N 105th Place
$4,500,000 9920 E Honey Mesquite Drive, #155
$4,200,000 37200 N Cave Creek Road, #1023
GRAB OUR FREE COURSES
➡️ 6 Steps To Home Buyer Success – http://vandykebuyerplan.com
➡️ 7 Steps To Home Seller Plan – http://vandykesellerplan.com
➡️ 8 Steps To Agent Success – http://vandykeagentplan.com


