 See photos and updates from listings directly in your feed
 Share your favorite listings with friends and family
 Save your search and get new listings directly in your mailbox before everybody else
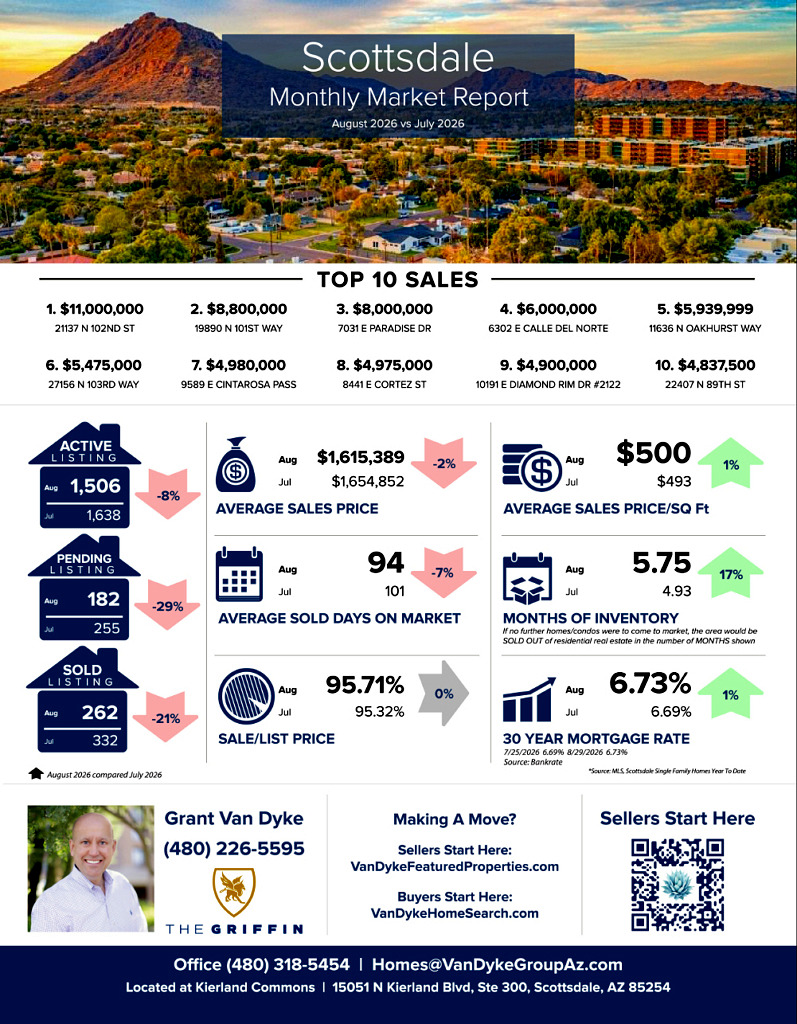
In the coming months, it will be important to watch whether elevated mortgage rates continue to suppress buyer demand as fewer sales, softer pricing, and expanding inventory shift more leverage toward buyers. Increased competition will place added pressure on sellers to price accurately, as aspirational pricing becomes increasingly difficult to defend. Updated, differentiated, and well-positioned homes can still attract serious interest, but continued weakness in sales could eventually lead to broader price reductions.
– Grant Van Dyke
Scottsdale
Average Sales Price: July 2026 > $1,654,852 vs August 2026 > $1,615,389 = 2% decrease
Average Days On Market: July 2026 > 101 vs August 2026 > 94 = 7% decrease
Average Sale Price Per Square Foot: July 2026 > $493 vs August 2026 > $500 = 1% increase
Sale to List Price Ratio: July 2026 > 95.32% vs August 2026 > 95.71% = No Change
Number of Sold Listings: July 2026 > 332 vs August 2026 > 262 = 21% decrease
Months Supply of Inventory: July 2026 > 4.93 vs August 2026 > 5.75 = 17% increase
Mortgage Rate: July 2026 > 6.69% vs August 2026 > 6.73% = 1% increase
Top 10 Sales
$11,000,000 21137 N 102nd St
$8,800,000 19890 N 101st Way
$8,000,000 7031 E Paradise Dr
$6,000,000 6302 E Calle Del Norte
$5,939,999 11636 N Oakhurst Way
$5,475,000 27156 N 103rd Way
$4,980,000 9589 E Cintarosa Pass
$4,975,000 8441 E Cortez St
$4,900,000 10191 E Diamond Rim Dr #2122
$4,837,500 22407 N 89th St
GRAB OUR FREE COURSES
➡️ 6 Steps To Home Buyer Success – http://vandykebuyerplan.com
➡️ 7 Steps To Home Seller Plan – http://vandykesellerplan.com
➡️ 8 Steps To Agent Success – http://vandykeagentplan.com