
Demand weakened, as it always does during the holiday season, which is why our supply took a 24% jump this month. However weak demand does not necessarily make a market crash. Excess supply is what really drives prices down hard, and we’re simply not seeing that. The downward pricing trend is actually weakening. Asking prices are now on the rise, and we’ll likely see closed prices following suit during the second quarter.
Grant Van Dyke
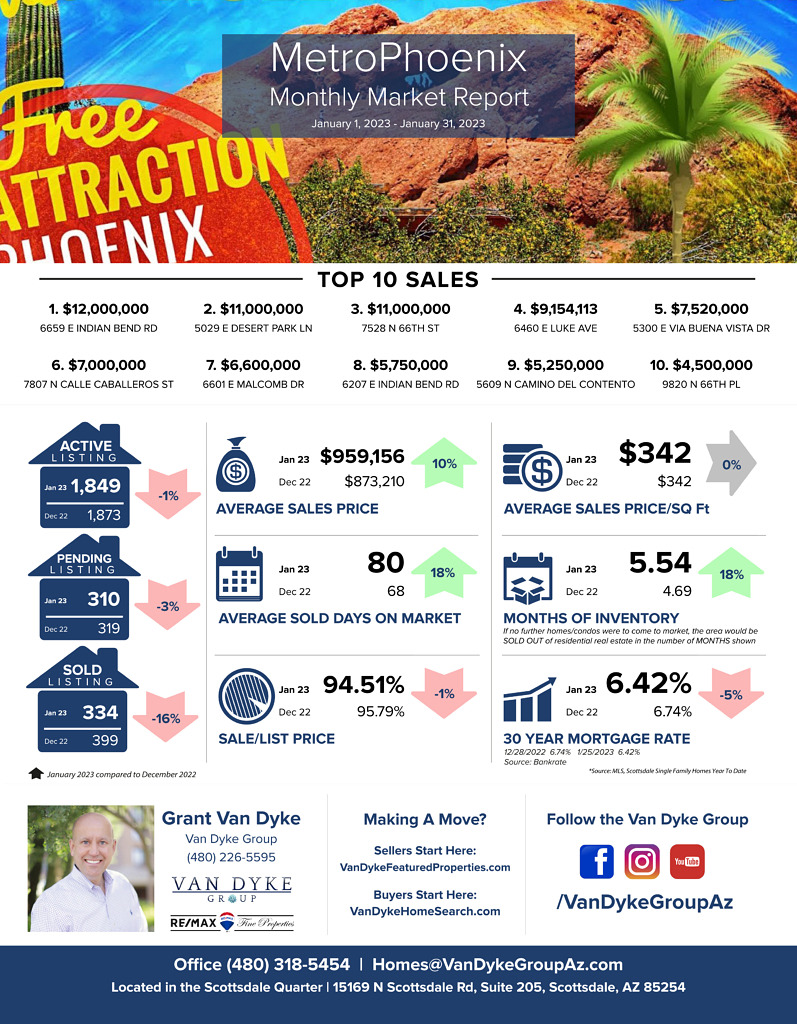
Metro Phoenix
Average Sales Price: December 2022 > $873,210 vs January 2023 > $959,156 = 10% increase
Average Days On Market: December 2022 > 68 vs January 2023 > 80 = 18% increase
Average Sale Price Per Square Foot: December 2022 > $342 vs January 2023 > $342 = 0% No Change
Sale to List Price Ratio: December 2022 > 95.79% vs January 2023 > 94.51% = 1% decrease
Number of Sold Listings: December 2022 > 399 vs January 2023 > 334 = 16% decrease
Months Supply of Inventory: December 2022 > 4.69 vs January 2023 > 5.54 = 18% increase
Mortgage Rate: December 2022 > 6.74% vs January 2023 > 6.42% = 5% decrease
Top 10 Sales
$12,000,000 6659 E Indian Bend Rd, Paradise Valley
$11,000,000 5029 E Desert Park Ln, Paradise Valley
$11,000,000 7528 N 66th St, Paradise Valley
$9,154,113 6460 E Luke Ave, Paradise Valley
$7,520,000 5300 E Via Buena Vista Dr, Paradise Valley
$7,000,000 7807 N Calle Caballeros St, Paradise Valley
$6,600,000 6601 E Malcomb Dr, Paradise Valley
$5,750,000 6207 E Indian Bend Rd, Paradise Valley
$5,250,000 5609 N Camino Del Contento, Paradise Valley
$4,500,000 9820 N 66th Pl, Paradise Valley


