
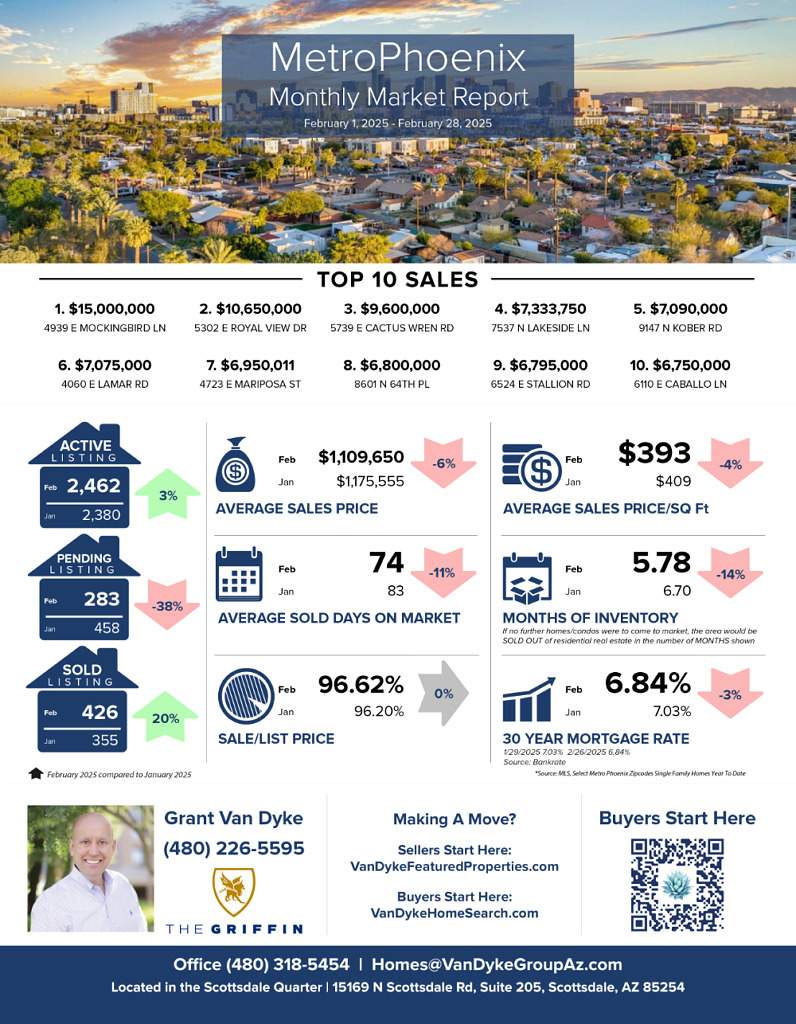
The 6% decline in average home prices, combined with an inventory level of 5.78 months, indicates that Metro Phoenix is currently exhibiting characteristics of a buyer’s market. Despite a 20% increase in sales activity, the available supply suggests that buyers maintain greater leverage in negotiations. Additionally, with mortgage rates declining to 6.84%, market conditions may incentivize home purchases before potential shifts in pricing dynamics occur.
– Grant Van Dyke
Metro Phoenix
Average Sales Price: January 2025 > $11,75,555 vs February 2025 > $11,09,650 = 6% decrease
Average Days On Market: January 2025 > 83 vs February 2025 > 74 = 11% decrease
Average Sale Price Per Square Foot: January 2025 > $409 vs February 2025 > $393 = 4% decrease
Sale to List Price Ratio: January 2025 > 96.20% vs February 2025 > 96.62% = 0%
Number of Sold Listings: January 2025 > 355 vs February 2025 > 426 = 20% increase
Months Supply of Inventory: January 2025 > 6.7 vs February 2025 > 5.78 = 14% decrease
Mortgage Rate: January 2025 > 7.03% vs February 2025 > 6.84% = 3% decrease
Top 10 Sales
$15,000,000 4939 E Mockingbird Ln, Paradise Valley
$10,650,000 5302 E Royal View Dr, Phoenix
$9,600,000 5739 E Cactus Wren Rd, Paradise Valley
$7,333,750 7537 N Lakeside Ln, Paradise Valley
$7,090,000 9147 N Kober Rd, Paradise Valley
$7,075,000 4060 E Lamar Rd, Paradise Valley
$6,950,011 4723 E Mariposa St, Phoenix
$6,800,000 8601 N 64th Pl, Paradise Valley
$6,795,000 6524 E Stallion Rd, Paradise Valley
$6,750,000 6110 E Caballo Ln, Paradise Valley
GRAB OUR FREE COURSES
- 6 Steps To Home Buyer Success – http://vandykebuyerplan.com
- 7 Steps To Home Seller Plan – http://vandykesellerplan.com
- 8 Steps To Agent Success – http://vandykeagentplan.com


