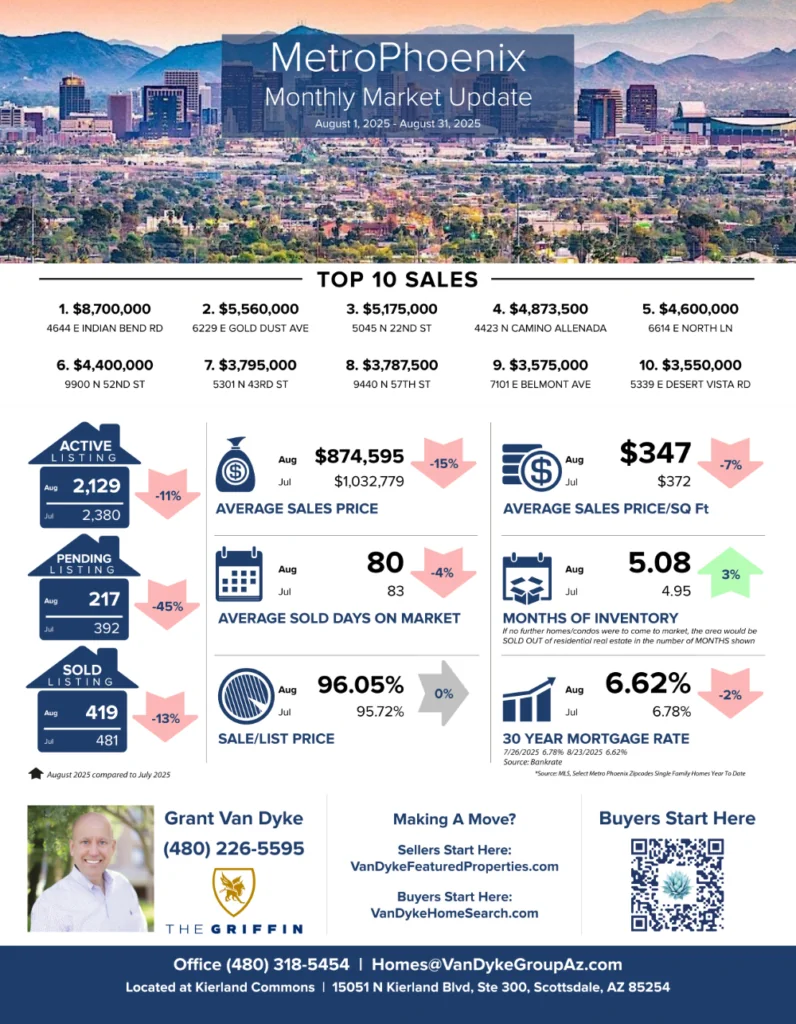
The Metro Phoenix housing market is shifting as we move into fall, with average home prices down 15% and price per square foot dipping to $347. While inventory rose slightly in August, the market still holds over five months of supply, giving buyers more leverage and keeping sellers competitive when pricing their homes. Meanwhile, mortgage rates have eased to 6.62%, the next few months could bring renewed buyer activity especially in mid- to upper-tier price ranges.
– Grant Van Dyke
Metro Phoenix
Average Sales Price: July 2025 > $1,032,779 vs August 2025 > $874,595 = 15% decrease
Average Days On Market: July 2025 > 83 vs August 2025 > 80 = 4% decrease
Average Sale Price Per Square Foot: July 2025 > $372 vs August 2025 > $347 = 7% decrease
Sale to List Price Ratio: July 2025 > 95.72% vs August 2025 > 96.05% = 0% No Change
Number of Sold Listings: July 2025 > 481 vs August 2025 > 419 = 13% decrease
Months Supply of Inventory: July 2025 > 4.95 vs August 2025 > 5.08 = 3% increase
Mortgage Rate: July 2025 > 6.78% vs August 2025 > 6.62% = 2% decrease
Top 10 Sales
$8,700,000 4644 E Indian Bend Rd, Paradise Valley
$5,560,000 6229 E Gold Dust Ave, Paradise Valley
$5,175,000 5045 N 22nd St, Phoenix
$4,873,500 4423 N Camino Allenada, Phoenix
$4,600,000 6614 E North Ln, Paradise Valley
$4,400,000 9900 N 52nd St, Paradise Valley
$3,795,000 5301 N 43rd St, Phoenix
$3,787,500 9440 N 57th St, Paradise Valley
$3,575,000 7101 E Belmont Ave, Paradise Valley
$3,550,000 5339 E Desert Vista Rd, Paradise Valley
GRAB OUR FREE COURSES
➡️ 6 Steps To Home Buyer Success – http://vandykebuyerplan.com
➡️ 7 Steps To Home Seller Plan – http://vandykesellerplan.com
➡️ 8 Steps To Agent Success – http://vandykeagentplan.com


