In the coming months, it’s important to watch if buyer activity picks up in response to growing inventory and softening prices, or if the market continues to cool. Sellers should closely monitor pricing trends, as overpricing in a shifting market can lead to extended days on the market. Meanwhile, strength in luxury sales, like those seen in Paradise Valley, may signal where demand is holding firm despite broader slowdowns.
– Grant Van Dyke
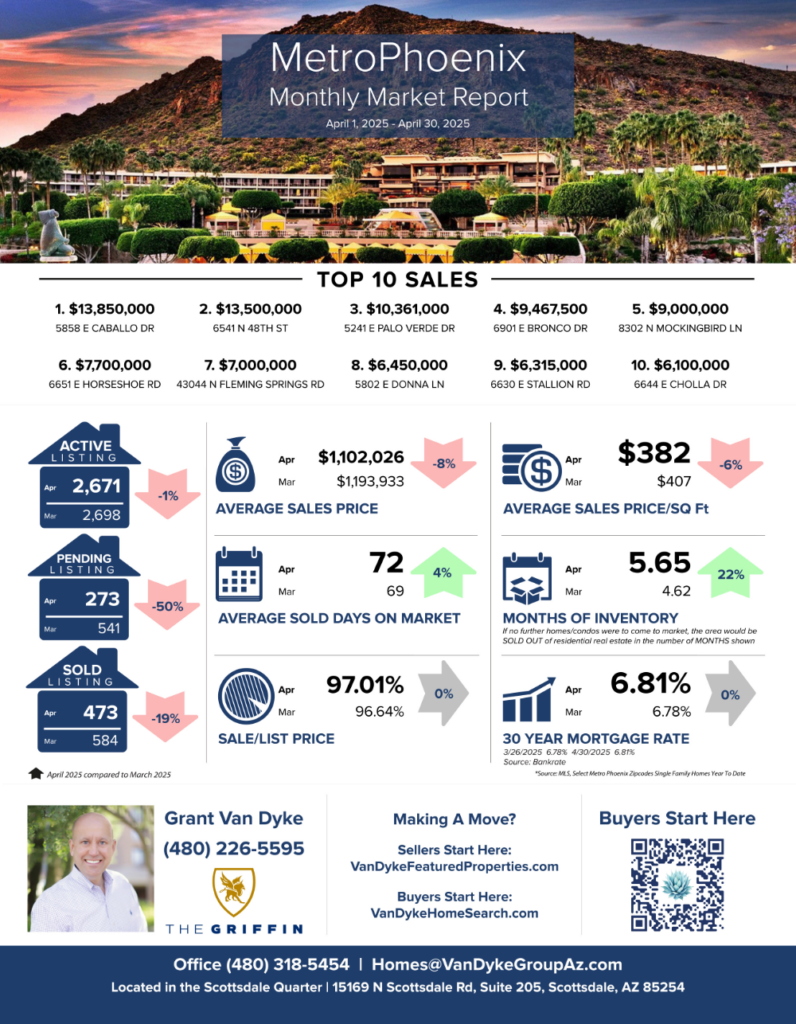
Metro Phoenix
Average Sales Price : March 2025 > $1,193,933 vs April 2025 > $1,102,026 = 8% decrease
Average Days On Market : March 2025 > 69 vs April 2025 > 72 = 4% increase
Average Sale Price Per Square Foot: March 2025 > $407 vs April 2025 > $382 = 6% decrease
Sale to List Price Ratio: March 2025 > 96.56% vs April 2025 > 97.01% = 0% change
Number of Sold Listings: March 2025 > 584 vs April 2025 > 473 = 19% decrease
Months Supply of Inventory: March 2025 > 4.62 vs April 2025 > 5.65 = 22% increase
Mortgage Rate: March 2025 > 6.78% vs April 2025 > 6.81% = 0% change
Top 10 Sales
$13,850,000 5858 E Caballo Dr, Paradise Valley
$13,500,000 6541 N 48th St, Paradise Valley
$10,361,000 5241 E Palo Verde Dr, Paradise Valley
$9,467,500 6901 E Bronco Dr, Paradise Valley
$9,000,000 8302 N Mockingbird Ln, Paradise Valley
$7,700,000 6651 E Horseshoe Rd, Paradise Valley
$7,000,000 43044 N Fleming Springs Rd, Cave Creek
$6,450,000 5802 E Donna Ln, Paradise Valley
$6,315,000 6630 E Stallion Rd, Paradise Valley
$6,100,000 6644 E Cholla Dr, Paradise Valley
GRAB OUR FREE COURSES
➡️ 6 Steps To Home Buyer Success – http://vandykebuyerplan.com
➡️ 7 Steps To Home Seller Plan – http://vandykesellerplan.com
➡️ 8 Steps To Agent Success – http://vandykeagentplan.com


