
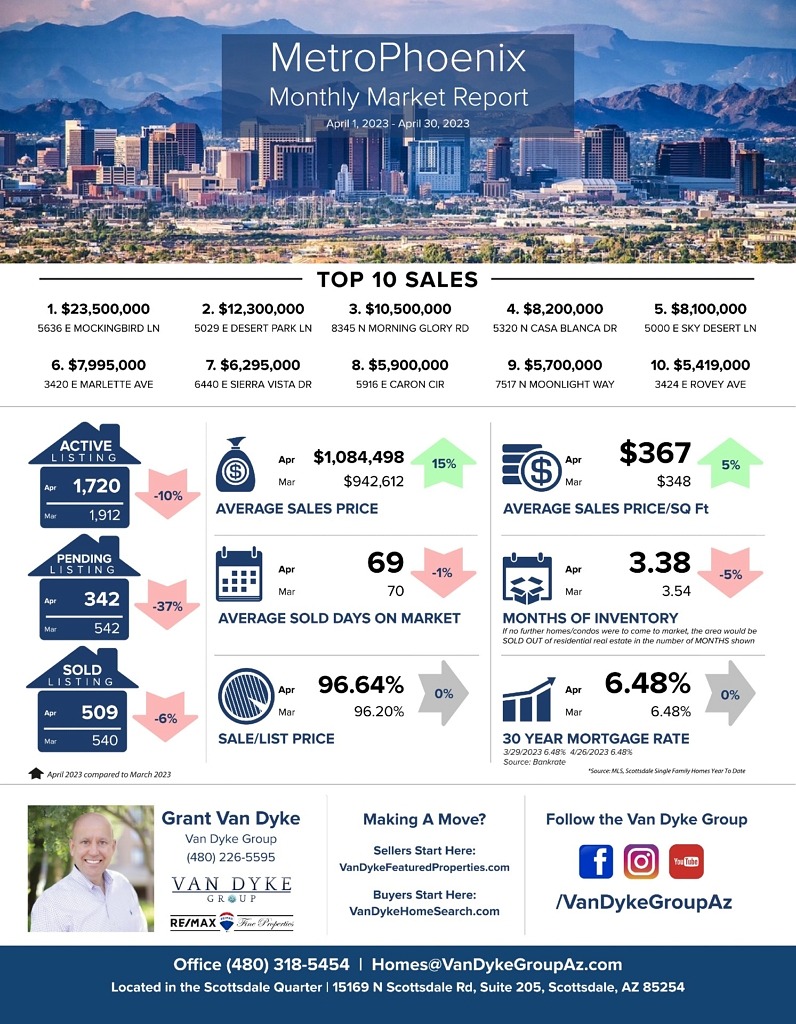
The month of April saw demand outpacing supply, shifting focus away from interest rates as the main driver of the market. The balance between supply and demand has shifted in favor of sellers since mid-November, indicating the market correction that caused a major slow down in the fourth quarter of 2022. With all this said, average sales prices are on the rise, and buyers are negotiating 4 to 5% off the listing prices. – Grant Van Dyke
Metro Phoenix
Average Sales Price: April 2023 > $1,084,498 vs March 2023 > $942,612 = 15% increase
Average Days On Market: April 2023 > 69 vs March 2023 > 70 = 1% decrease
Average Sale Price Per Square Foot: April 2023 > $367 vs March 2023 > $348 = 5% increase
Sale to List Price Ratio: April 2023 > 96.64% vs March 2023 > 96.20% = 0%
Number of Sold Listings: April 2023 > 509 vs March 2023 > 540 = 6% decrease
Months Supply of Inventory: April 2023 > 3.38 vs March 2023 > 3.54 = 5% decrease
Mortgage Rate: April 2023 > 6.48% vs March 2023 > 6.48% = 0%
Top 10 Sales
$23,500,000 5636 E Mockingbird Ln, Paradise Valley
$12,300,000 5029 E Desert Park Ln, Paradise Valley
$10,500,000 8345 N Morning Glory Rd, Paradise Valley
$8,200,000 5320 N Casa Blanca Dr, Paradise Valley
$8,100,000 5000 E Sky Desert Ln, Paradise Valley
$7,995,000 3420 E Marlette Ave, Paradise Valley
$6,295,000 6440 E Sierra Vista Dr, Paradise Valley
$5,900,000 5916 E Caron Circle, Paradise Valley
$5,700,000 7517 N Moonlight Way, Paradise Valley
$5,419,000 3424 E Rovey Ave, Paradise Valley


