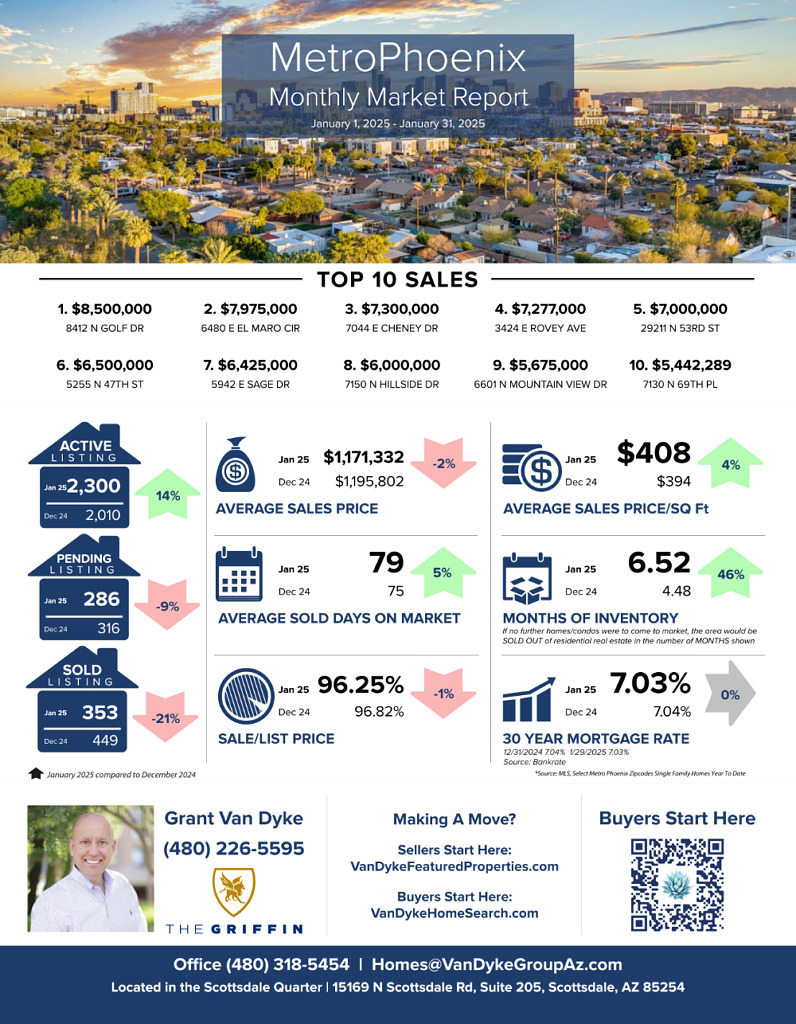
The Metro Phoenix real estate market saw a 21% drop in sold listings, signaling a slowdown in buyer activity, while inventory surged 46% to 6.52 months of supply, giving buyers more options. Despite a 2% dip in average sales price to $1,171,332, the price per square foot increased to $408, indicating a shift toward smaller or more efficient homes. With mortgage rates holding steady at 7.03%, buyers have a chance to negotiate better deals as sellers adjust to a changing market.
– Grant Van Dyke
Metro Phoenix
Average Sales Price: December 2024 > $1,195,802 vs January 2025 > $1,171,332 = 2% decrease
Average Days On Market: December 2024 > 75 vs January 2025 > 79 = 5% increase
Average Sale Price Per Square Foot: December 2024 > $394 vs January 2025 > $408 = 4% increase
Sale to List Price Ratio: December 2024 > 96.82% vs January 2025 > 96.25% = 1% decrease
Number of Sold Listings: December 2024 > 449 vs January 2025 > 353 = 21% decrease
Months Supply of Inventory: December 2024 > 4.48 vs January 2025 > 6.52 = 46% increase
Mortgage Rate: December 2024 > 7.04% vs January 2025 > 7.03% = 0% Change
Top 10 Sales
$8,500,000 8412 N Golf Dr, Paradise Valley
$7,975,000 6480 E El Maro Cir, Paradise Valley
$7,300,000 7044 E Cheney Dr, Paradise Valley
$7,277,000 3424 E Rovey Ave, Paradise Valley
$7,000,000 29211 N 53rd St, Cave Creek
$6,500,000 5255 N 47th St, Phoenix
$6,425,000 5942 E Sage Dr, Paradise Valley
$6,000,000 7150 N Hillside Dr, Paradise Valley
$5,675,000 6601 N Mountain View Dr, Paradise Valley
$5,442,289 7130 N 69th Pl, Paradise Valley


